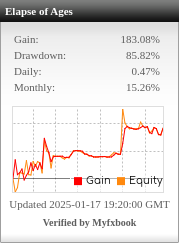
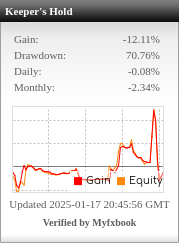
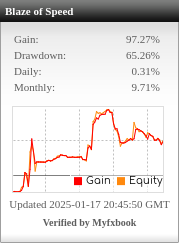
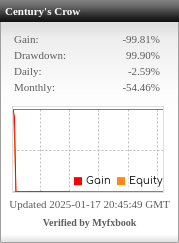
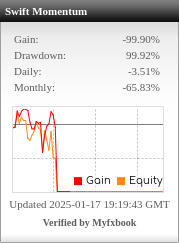
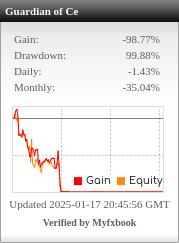
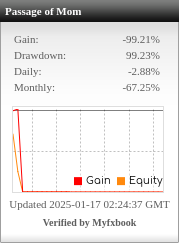
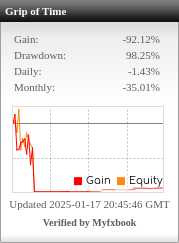
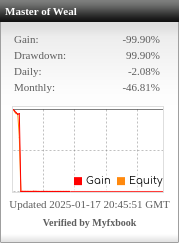
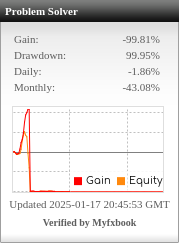
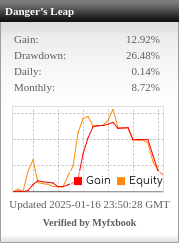
OOS Testing: More importantly, assess the performance during out-of-sample testing to ensure the strategy is robust in unseen market conditions. Strategies with a high OOS Sharpe ratio and low OOS drawdowns are more likely to perform well in live trading.
this OOS should be > ?
When assessing out-of-sample (OOS) performance, the following benchmarks can help determine if a strategy is robust enough for live trading:
1. OOS Sharpe Ratio:
- A Sharpe ratio greater than 1 indicates that the strategy has delivered excess returns relative to its volatility.
- A Sharpe ratio of greater than 2 is considered excellent, suggesting strong performance and favorable risk-adjusted returns.
2. OOS Drawdown:
- Aim for a maximum drawdown of less than 15%. This benchmark helps ensure that the strategy does not experience severe losses that could jeopardize the trading account.
- Additionally, the recovery time from drawdown is important; faster recovery is generally preferable.
3. Profit Factor:
- A profit factor greater than 1.5 is generally favorable. This means that the strategy makes 1.5 times more profit than it loses.
4. Consistency:
- Look for consistency in OOS performance metrics, such as stable returns and low volatility, over a sufficient sample size (e.g., at least 6-12 months of trading).
Summary:
- OOS Sharpe Ratio > 1 (ideally > 2)
- Maximum OOS Drawdown < 15%
- Profit Factor > 1.5
Meeting these benchmarks can indicate that the strategy is likely to perform well in live trading.

