DNYL . SPACE

As motivation plays a crucial role in reaching these goals.

Author: admin

Screenshot 259

Let’s analyze the trend for this evening (July 23) and plan 2 trade patterns.

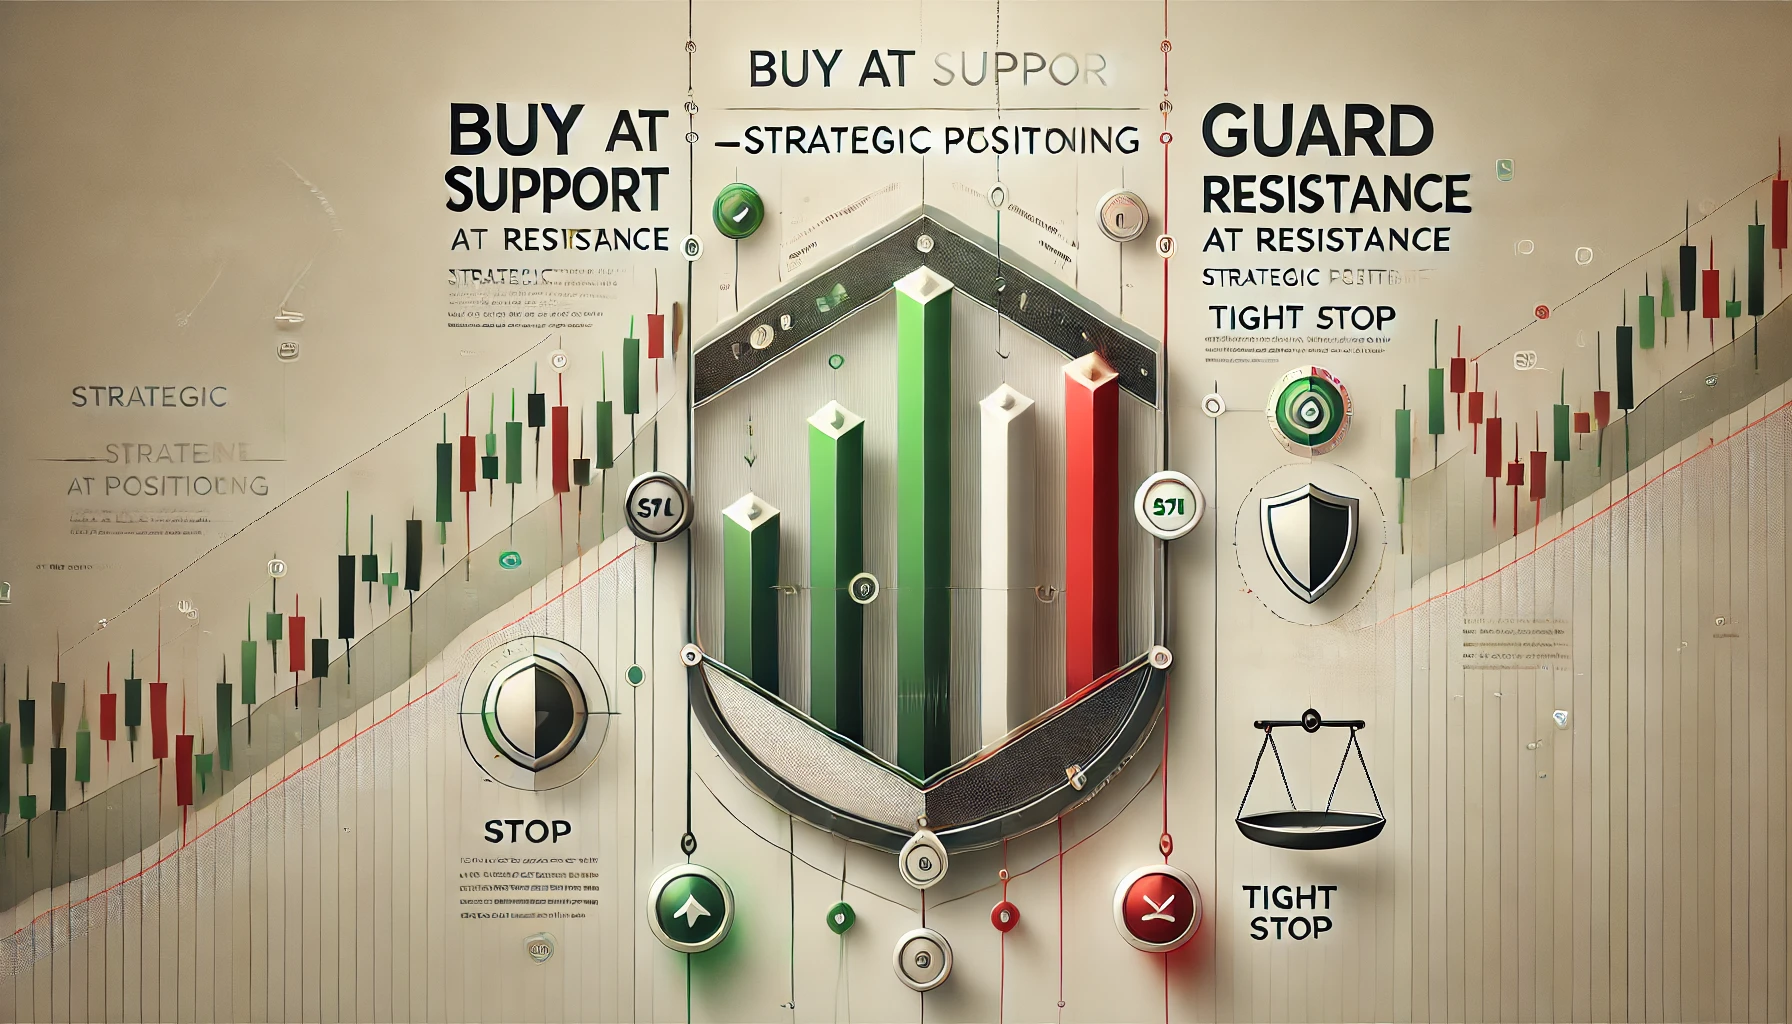
The analysis focuses on the trading strategies for the evening of July 23, highlighting the strong upward trend in the market. The momentum is substantial, with prices consistently above key support levels, signaling that traders should primarily look for upward movement. The analysis emphasizes the importance of waiting for a “Buy on Dip” opportunity, particularly as high momentum levels may lead to a temporary overbought condition, increasing risks when buying at peak prices.

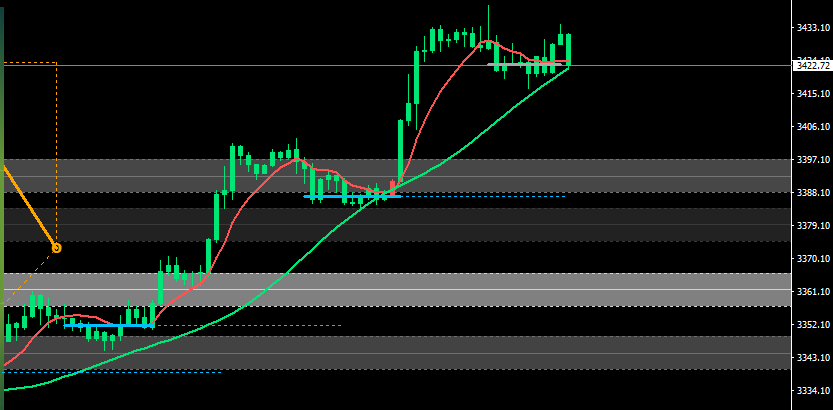
The first trading strategy discussed is Intraday trading, which is suitable for those who prefer not to monitor the market constantly. This strategy involves buying during price dips within the established upward trend. Key buy zones are identified between $3415 and $3390, with specific stop-loss and take-profit markers set to manage risk and maximize potential gains. The approach aims to capitalize on price corrections while maintaining a focus on the broader upward trajectory of the market.


The second trading strategy outlined is Scalping, which involves quick trades lasting between 5 to 15 minutes. This approach requires rapid decision-making and close monitoring of price movements. Two scenarios are presented: the first involves entering a buy position upon a breakout above previous highs, while the second suggests a sell position if the price fails to surpass resistance levels. Each scenario includes specific entry points, stop-loss thresholds, and take-profit targets, highlighting the need for agility in handling short-term trades.

The implications of these strategies extend beyond immediate profits; they reflect the current market conditions and trader sentiment. Intraday trading allows for capturing larger market movements while minimizing exposure to long-term volatility. Conversely, scalping focuses on exploiting small price fluctuations, which can be profitable in a highly liquid market. Both strategies require careful risk management to navigate the uncertainties of trading effectively.

In conclusion, the analysis provides a comprehensive overview of effective trading strategies for the evening session, emphasizing the importance of timing and market conditions. By employing the “Buy on Dip” strategy in the context of intraday trading and scalping, traders can optimize their chances of success. Understanding these methodologies can significantly enhance trading performance in a dynamic market environment, enabling traders to make informed decisions and adapt to changing conditions.

Dall·e 2025 02 03 10.30.20   A Futuristic High Tech Trading Lab With Multiple Holographic Screens Displaying Financial Charts And Currency Pairs. The Screens Highlight Currency Pa

Fact Faq #5: Finalize

Which 10 currency pairs would you recommend for 10 rounds?

When selecting currency pairs for 10 rounds of testing, consider pairs with diverse volatility and market behavior. This allows for a comprehensive and effective strategy across different markets. Examples of 10 recommended currency pairs include:

EUR/USD – A popular, highly liquid pair
GBP/USD – High volatility
USD/JPY – A pair correlated with the stock market
AUD/USD – Sensitive to commodities
USD/CAD – Linked to oil
EUR/JPY – Cross-regional correlation
GBP/JPY – High volatility
EUR/GBP – A European pair
NZD/USD – Correlated with commodities, similar to AUD
USD/CHF – Often used as a safe haven asset during high market risk periods.

You can adapt this list of currency pairs to suit your needs and the market behaviors you’re interested in.


Monte Carlo process results

For the Monte Carlo process results that did not pass the walk-forward matrix in the Ending section, should we re-apply them to Genetic evo or not?

If a strategy passes the Monte Carlo process but fails the Walk-Forward Matrix (WFM) in the Ending section, it may indicate that the strategy is vulnerable to real market changes. Although it may be resilient to random sampling (Monte Carlo), it may not adapt well to changing times (Walk-Forward Matrix). Considering reapplying this strategy in a Genetic Evolution:

Benefits of reuse:

You may find good elements within the strategy, but they require adjustment to fit changing market conditions. Using Genetic Evolution may help find parameter sets that are more flexible and adaptable.

Drawbacks of reuse:

If the strategy completely fails the WFM, it may indicate a fundamental problem within the strategy, which adjustments may not resolve. It may be a waste of time to attempt to refine a strategy likely to fail in the long run.

Recommended Approach:

Analyze the cause: Before reapplying the strategy to Genetic Evolution, analyze why it failed the WFM, such as overfitting or inability to adapt to changing markets.
Apply only parts: If parts of the strategy show promise, these parts can be incorporated or improved upon in a new Genetic Evolution process.
Create new conditions: In the new Genetic Evolution round, new conditions or constraints could be added to ensure the strategy passes the WFM or becomes more resilient.

Re-applying a strategy that failed the WFM to Genetic Evolution can be a good approach if proper analysis and improvement are undertaken. This can give the strategy a better chance to adapt and succeed in a wider range of market conditions.

Dall·e 2025 02 03 10.17.24   A High Tech Trading Lab With Multiple Holographic Screens Displaying Financial Charts, Algorithmic Trading Strategies, And Market Trends. The Environm

Fact Faq #4: Summarized previously as new engine

A. Building…

Create 10 strategies using Genetic Evolution.
1.1 Breakout Strategy
1.2 Day Trading Strategy
1.3 Grid Trading
1.4 Multi-Timeframe Divergence Strategy
1.5 News Trading
1.6 Oscillator Reversion and Momentum Burst Strategy
1.7 Range Trading Strategy
1.8 Scalping Strategy
1.9 Swing Trading
1.10 Trend Trading Strategy

Use TF H1/H4 – Opened Timeframe – Ranking Profit > 1.4 Ret/DD > 4 Min trade per month > 2 – No Cross check / Robustness test
** Market Entry Method: Enter at market / Reverse / Stop / Limit pending
*** Filter each step by 10 entries per market entry method, totaling 40 in one main group, and a total of 400.
**** Enable Exit types: MoveSL2BE / SL2BE add pips / Profit target / Stop loss / Trailing stop / Trailing activation / Exit rules
***** Trading option: Friday Exit 23:00
****** Money management: Risk fixed % of account

B. Melting…

Backtest all 400 results against 10 currency pairs, separating the timeframe into 5 TFs.
2.1 H1/H4 – M30/H4 – M15/H1 – M5/H1 – M15/M30
2.2 Aggregate the results and perform Automatic Retest by changing the Precision to 1-minute data tick simulation, but maintain the original trading settings.
2.3 Add Monte Carlo trades manipulation and Sequential optimization testing.
2.4 Save the results to the @Blender folder.
2.5 Perform another Automatic Retest using only the Walk-Forward Matrix.
2.6 Save the results to the @Melted folder.

C. Ending…

Load all files from @Blender into the Initial Population to create a new set of EA, repeating the process 10 times (10 currency pairs).
3.1 Create 3 new steps: Build Martingale / ATM / Everyday Exit
3.2 Automatic Retest with the original trading settings at 3 timeframes (H1/H4 – M30/H4 – M15/H1), using 2 Monte Carlo factors (trades manipulation and retest methods) and Sequential optimization.
3.3 Another Automatic Retest with 1-minute data tick simulation, using 2 Monte Carlo factors and Sequential optimization.
3.4 Another Automatic Retest using the Walk-Forward Matrix.

Dall·e 2025 02 02 12.24.03   A High Tech Trading Analysis Room With Multiple Holographic Displays Showcasing Various Financial Data And Charts. The Environment Is Futuristic, With

Fact Faq #3: What parts could be cut out?

Considering removing unnecessary parts or reducing certain processes can help improve efficiency and reduce processing time. Here are some suggestions for possible cuts or reductions:

1. Number of strategies in the Building phase:

Currently: You create 20 different strategies.
Suggestion: Try reducing the number of strategies generated in each cycle, starting by selecting the most likely successful strategies. For example, choose 10 strategies that are popular in the current market conditions or have been tested and are more likely to yield good results.

2. Number of currency pairs in the Melting phase:

Currently: You test all 30 currency pairs.
Suggestion: Reduce the number of currency pairs in the initial test rounds. You may select major currency pairs with high liquidity, such as EUR/USD, GBP/USD, etc., which will reduce the overall testing time.

3. Timeframes in testing:

Currently: Testing is done on 10 timeframes.
Suggestion: Try reducing the number of timeframes used in the test, focusing on only relevant timeframes to your developed strategies, such as H1/H4 or M15/H1, which are more likely to give accurate results.

4. Automatic Retest phase:

Currently: You perform Automatic Retest multiple times.
Suggestion: Reduce the number of Automatic Retest cycles. Perform it only once after the Monte Carlo test to save time.

5. Use of Monte Carlo:

Currently: Using multiple Monte Carlo methods.
Suggestion: Consider using only one method that gives the most appropriate result or use it only in the final round of testing to save time.

6. Walk-Forward Matrix:

Currently: You use the Walk-Forward Matrix in multiple steps.
Suggestion: Reduce the use of the Walk-Forward Matrix in some steps and use it only in the final step to confirm the best results.

7. Adding new steps in the Ending phase:

Currently: You add new steps in each cycle.

Suggestion: Try limiting the addition of new steps in certain cycles, or only when unsatisfactory results are found from previous testing.
These reductions will help reduce overall processing time and make your EA creation more efficient without sacrificing the quality of the results obtained.

Dall·e 2025 02 02 12.20.22   A High Tech Trading Analysis Room With Multiple Holographic Screens Displaying Trading Strategies, Performance Graphs, And Testing Results. The Room H

Fact Faq #2: Disadvantage or a Good outcome?

Your current step-by-step process has both advantages and disadvantages to consider:

Advantages

Strategy diversity: Creating 20 strategies allows for greater trading diversity, increasing the chance of finding effective strategies in different market conditions.
Comprehensive testing: Backtesting with multiple currency pairs and different timeframes provides a comprehensive view of the strategy’s performance in various conditions, making the results more reliable.
Monte Carlo and Walk-Forward Testing: Increases confidence in the robustness of the strategy, as these tests simulate unexpected situations and market fluctuations.

Disadvantages

Time-consuming: Complex steps like backtesting and parameter adjustments for each strategy require significant processing time, which may hinder strategy development and improvement within limited time.
High resource consumption: Testing multiple iterations and multiple timeframes requires high computer resources, potentially causing delays on lower-performance machines.
Complexity of the process: The diverse and complex steps can make result analysis challenging and may increase the possibility of errors during processing.

Evaluation

Positive results if you can efficiently manage processing time and resources, and the results from comprehensive testing can be used to improve strategy effectiveness.
Negative aspects if the long processing time and high resource requirements prevent you from making timely improvements or developing, or causing the strategy to be delayed in responding to changing market conditions.

You can assess which steps take too long and consider reducing or simplifying those steps to improve overall efficiency.

Dall·e 2025 02 02 12.07.42   A High Tech Trading Lab With Holographic Displays Showing The Step By Step Process Of Creating An Expert Advisor (ea) For Forex Trading. The Room Is S

Fact Faq #1: Summary my setup.

These are the steps for creating our EA, based on our conversation. Please clarify and analyze which parts take too long. My complete EA creation steps:

A. Building..

1. Creating 20 strategies using Genetic Evolution.
1.1 Breakout Strategy
1.2 Carry Trade Strategy
1.3 Cycle-Based Trend Reentry Strategy
1.4 Day Trading Strategy
1.5 Dynamic Momentum and Price Rejection Strategy
1.6 Grid Trading
1.7 Market Chaos and Divergence Strategy
1.8 Mean Reversion on Trend Weakness
1.9 Multi-Timeframe Divergence Strategy
1.10 News Trading
1.11 Oscillator Reversion and Momentum Burst Strategy
1.12 Position Trading
1.13 Price Action Trading
1.14 Range Trading Strategy
1.15 Retracement Trading
1.16 Scalping Strategy
1.17 Sentiment and Momentum Reversal Strategy
1.18 Swing Trading
1.19 Trend Channel Momentum Strategy
1.20 Trend Trading Strategy

* Using TF H1/H4 – Opened Timeframe – Ranking Profit > 1.4 Ret/DD >4 Min trade per month > 2 – No Cross check / Rubustness test
** Entering always includes Enter at market / Reverse / Stop / Limit pending
*** Filtering each step with 25 entries per market entry type, totaling 100 entries per main category, and a total of 2000 entries.
**** Enabling Exit types: MoveSL2BE / SL2BE add pips / Profit target / Stop loss / Trailing stop / Trailing activation / Exit rules
***** Trading option: Friday Exit 23:00
****** Money management: Risk fixed % of account


A. Building Improved

• Create 20 strategies using Genetic Evolution, which takes time for filtering and refining.
• Filtering 25 strategies for market entry and multiple exit options increases processing time.
• Setting money management complicates calculations.


B. Melting..

2. Testing all 2000 results backtested with all 30 currency pairs, separating timeframes into 10 TFs.
2.1 H1/H4 – M30/H4 – M15/H4 – M5/H4 – M5/H1 – M15/H1 – M30/H1 – M15/M30 – M5/M30 – M5/M15
2.2 Combining the above results for Automatic Retest by changing Precision to 1-minute data tick simulate, but adhering to the original trading settings.
2.2 Adding Monte Carlo trades manipulation – Monte Carlo retest methods and Sequential optimization by changing values in the respective EAs.
2.3 Saving successful files in Folder @Blender
2.4 Automatic retest using only Walk-Forward Matrix.
2.5 Saving successful files in @Melted

B. Melting Improved

• Backtesting 30 currency pairs and various timeframes is time-consuming, especially with trading value changes and Monte Carlo testing.
• Automatic retests with 1-minute tick data and Walk-Forward Matrix require high computational power.


C. Ending..

3. Loading all files in @Blender into the Initial Population to create entirely new EAs, repeating 30 times (30 currency pairs).
3.1 Creating 5 new steps: Build Martingale / ATM / Everyday Exit / Risk % account, and using all Exit types.
3.2 Automatic retest with the original trading settings for 5 timeframes (H1/H4 – m30/h4 – m15/h4 – m5/h4 – m5/h1 – m15/h1 – m30/h1). Using the original settings for Opened timeframe. Using Monte Carlo, both (trades manipulation and retest methods), and Sequential optimization. Adding strategies that passed.
3.3 Automatic retest for all, another round, with 1-minute data tick simulation, with both Monte Carlo (2 versions) and Sequential optimize as before.
3.4 Automatic retest for all, another round, using walk-forward matrix.

C. Ending Improved

• Loading files in @Blender to create 30 new EAs is time-intensive, particularly with additional strategies.
• Multiple automatic retests using Monte Carlo and Sequential Optimization increase processing time.


Conclusion:
Suggestions include reducing strategies and pairs tested, considering partial parameter adjustments, and using more efficient processing tools to save time.


Download (31)

Master of the Forge EA


Here’s the detailed analysis for your new EA, Master of the Forge – XAUUSD M30-unlocked:

General Overview

  • Symbol: XAUUSD (Gold vs USD)
  • Testing Period: From May 7, 2003, to December 31, 2024, using the 30-minute timeframe (M30).
  • Initial Deposit: $10,000
  • Total Net Profit: $94,449.51
  • Gross Profit: $259,425.54
  • Gross Loss: -$164,976.03
  • Profit Factor: 1.57 (indicating that the EA made $1.57 for every $1 lost).

Performance Highlights

  • Total Trades: 7,228
    • Short Positions (won %): 3,136 (44.42%)
    • Long Positions (won %): 4,092 (47.80%)
  • Winning Trades: 3,349 (46.33% of total trades)
  • Losing Trades: 3,879 (53.67% of total trades)

Profit and Loss

  • Largest Profit Trade: $925.30
  • Largest Loss Trade: -$1,488.30
  • Average Profit per Trade: $77.46
  • Average Loss per Trade: -$42.53

Risk and Drawdown

  • Absolute Drawdown: $1,289.06
  • Maximal Drawdown: $3,793.58 (4.34%)
  • Relative Drawdown: 14.63%

Consecutive Trades

  • Maximum Consecutive Wins: 17 trades, totaling $2,314.62
  • Maximum Consecutive Losses: 23 trades, totaling -$1,881.73
  • Maximal Consecutive Profit: $4,163.84 over 9 winning trades
  • Maximal Consecutive Loss: -$1,881.73 over 23 losing trades
  • Average Consecutive Wins: 3
  • Average Consecutive Losses: 4

Key Insights

  1. Profitability: The EA shows a solid net profit of $94,449.51, with a profit factor of 1.57, indicating profitability but a slight margin over costs.
  2. Win Rate: The win rates for both short and long positions are moderate, with long positions having a slightly higher success rate.
  3. Risk Management: The maximal drawdown is relatively low at 4.34%, suggesting a more controlled risk profile compared to previous EAs. The relative drawdown of 14.63% indicates a reasonable balance between profit potential and risk.
  4. Trade Efficiency: The average profit per trade is higher than the average loss per trade, indicating favorable trade outcomes.
  5. Consecutive Trades: The EA manages to string together up to 17 consecutive winning trades, with a maximum consecutive loss streak of 23 trades, which is relatively high and suggests potential periods of volatility.

Recommendations

  • Risk Fine-Tuning: The EA’s drawdown levels are manageable, but further fine-tuning the Martingale multiplier or trade lot sizes could help in mitigating the potential for long losing streaks.
  • Win Rate Improvement: Strategies to slightly improve the win rate, such as refining entry criteria or using additional indicators, might enhance overall performance.
  • Monitoring Long Losing Streaks: Since the EA experiences relatively long losing streaks, it may benefit from incorporating measures to halt trading temporarily or adjust strategies during such periods to minimize losses.
Download (30)

Gleam of Thought EA


General Overview

  • Symbol: XAUUSD (Gold vs USD)
  • Testing Period: From May 7, 2003, to November 1, 2024, using the 30-minute timeframe (M30).
  • Initial Deposit: $10,000
  • Total Net Profit: $34,556.24
  • Gross Profit: $116,113.56
  • Gross Loss: -$81,557.32
  • Profit Factor: 1.42 (indicating that the EA made $1.42 for every $1 lost).

Performance Highlights

  • Total Trades: 4,699
    • Short Positions (won %): 1,441 (39.35%)
    • Long Positions (won %): 3,258 (44.23%)
  • Winning Trades: 2,008 (42.73% of total trades)
  • Losing Trades: 2,691 (57.27% of total trades)

Profit and Loss

  • Largest Profit Trade: $760.42
  • Largest Loss Trade: -$526.70
  • Average Profit per Trade: $57.83
  • Average Loss per Trade: -$30.31

Risk and Drawdown

  • Absolute Drawdown: $2,326.98
  • Maximal Drawdown: $8,777.12 (27.29%)
  • Relative Drawdown: 27.29%

Consecutive Trades

  • Maximum Consecutive Wins: 11 trades, totaling $741.10
  • Maximum Consecutive Losses: 28 trades, totaling -$348.48
  • Maximal Consecutive Profit: $1,906.70 over 5 winning trades
  • Maximal Consecutive Loss: -$1,505.90 over 3 losing trades
  • Average Consecutive Wins: 2
  • Average Consecutive Losses: 3

Key Insights

  1. Profitability: The EA has a lower total net profit of $34,556.24 compared to the previous EAs. The profit factor of 1.42 suggests that it’s profitable but less efficient in terms of profit per dollar lost.
  2. Win Rate: Both short and long positions have win rates below 45%, indicating a lower success rate compared to the other EAs.
  3. Risk Management: The relative drawdown is higher at 27.29%, which shows that this EA carries more risk in terms of capital drawdown. This is notably higher than in the other EAs, suggesting more significant potential losses.
  4. Trade Efficiency: The average profit per trade and average loss per trade suggest smaller gains and losses per trade compared to the other EAs.
  5. Consecutive Trades: The EA experiences longer losing streaks (28 consecutive losses), which could be concerning for drawdown management and recovery.

Recommendations

  • Risk Adjustment: Consider adjusting the risk percentage or introducing stop-loss limits to manage and reduce the drawdown.
  • Strategy Refinement: The relatively lower win rate and higher drawdown suggest the strategy may need refinement, possibly by tightening entry and exit criteria.
  • Diversification: Testing on different symbols or additional timeframes could help balance the performance and reduce drawdown risks.
Download (29)

Gatekeeper EA


Here’s a humanized summary and analysis of your Expert Advisor (EA) performance based on the Strategy Tester Report for “Gatekeeper – XAUUSD M30-unlocked”:

General Overview

  • Symbol: XAUUSD (Gold vs USD)
  • Testing Period: From May 7, 2003, to November 1, 2024, using the 30-minute timeframe (M30).
  • Initial Deposit: $10,000
  • Total Net Profit: $80,201.54
  • Gross Profit: $250,994.72
  • Gross Loss: -$170,793.18
  • Profit Factor: 1.47 (indicating that the EA made $1.47 for every $1 lost).

Performance Highlights

  • Total Trades: 8,207
    • Short Positions (won %): 3,172 (45.55%)
    • Long Positions (won %): 5,035 (42.84%)
  • Winning Trades: 3,602 (43.89% of total trades)
  • Losing Trades: 4,605 (56.11% of total trades)

Profit and Loss

  • Largest Profit Trade: $890.28
  • Largest Loss Trade: -$1,053.60
  • Average Profit per Trade: $69.68
  • Average Loss per Trade: -$37.09

Risk and Drawdown

  • Absolute Drawdown: $2,412.64 (This is the maximum decline in the account balance from the initial deposit).
  • Maximal Drawdown: $5,193.10 (7.05%)
  • Relative Drawdown: 24.52% ($2,465.38)

Consecutive Trades

  • Maximum Consecutive Wins: 15 trades, totaling $728.30
  • Maximum Consecutive Losses: 22 trades, totaling -$399.54
  • Maximal Consecutive Profit: $3,665.64 over 8 winning trades
  • Maximal Consecutive Loss: -$2,904.18 over 9 losing trades
  • Average Consecutive Wins: 2
  • Average Consecutive Losses: 3

Key Insights

  1. Profitability: The EA has been profitable with a total net profit of $80,201.54 over the testing period. The profit factor of 1.47 indicates more profits than losses, but there is room for improvement.
  2. Trade Distribution: With a win rate of approximately 44%, the EA is losing more trades than it wins, which is common in many trading systems that focus on larger wins than losses.
  3. Risk Management: The relative drawdown of 24.52% is on the higher side, which suggests the EA takes significant risks. A lower drawdown would be preferable to reduce the risk of large losses.
  4. Consistency: The maximum consecutive wins and losses indicate periods of both winning and losing streaks. The EA has a reasonable balance in terms of consecutive wins and losses, but it experiences more losing trades than winning trades in terms of total counts.
  5. Money Management: The strategy uses a simple Martingale money management system, which increases trade size after losses. This can amplify both profits and losses, contributing to the observed drawdown levels.

Recommendations

  • Optimization: Consider optimizing the Martingale parameters to reduce drawdown and improve overall stability.
  • Risk Control: Introduce more conservative risk management rules to lower the relative drawdown.
  • Win Rate: Explore ways to improve the win rate, such as refining entry and exit signals or incorporating additional filters to avoid unfavorable market conditions.
  • Diversification: Test the EA on different symbols or timeframes to diversify and potentially enhance overall performance.
Download (28)

Gate of Time EA


Here’s a detailed analysis of your new EA, Gate of Time – XAUUSD M30-unlocked:

General Overview

  • Symbol: XAUUSD (Gold vs USD)
  • Testing Period: From May 7, 2003, to November 1, 2024, using the 30-minute timeframe (M30).
  • Initial Deposit: $10,000
  • Total Net Profit: $112,007.32
  • Gross Profit: $303,565.93
  • Gross Loss: -$191,558.62
  • Profit Factor: 1.58 (indicating that the EA made $1.58 for every $1 lost).

Performance Highlights

  • Total Trades: 7,005
    • Short Positions (won %): 3,128 (55.37%)
    • Long Positions (won %): 3,877 (56.41%)
  • Winning Trades: 3,919 (55.95% of total trades)
  • Losing Trades: 3,086 (44.05% of total trades)

Profit and Loss

  • Largest Profit Trade: $3,458.74
  • Largest Loss Trade: -$1,047.55
  • Average Profit per Trade: $77.46
  • Average Loss per Trade: -$62.07

Risk and Drawdown

  • Absolute Drawdown: $1,153.19 (This is the maximum decline in the account balance from the initial deposit).
  • Maximal Drawdown: $3,284.70 (3.14%)
  • Relative Drawdown: 14.80% ($2,210.33)

Consecutive Trades

  • Maximum Consecutive Wins: 20 trades, totaling $3,854.22
  • Maximum Consecutive Losses: 16 trades, totaling -$484.04
  • Maximal Consecutive Profit: $4,232.50 over 6 winning trades
  • Maximal Consecutive Loss: -$1,802.42 over 9 losing trades
  • Average Consecutive Wins: 3
  • Average Consecutive Losses: 3

Key Insights

  1. Profitability: The EA shows a strong profitability with a total net profit of $112,007.32, which is higher than the previous EA. The profit factor of 1.58 indicates a better return for every dollar lost.
  2. Win Rate: Both short and long positions have win rates above 55%, which is a significant improvement over the previous EA. This indicates better trade selection or execution.
  3. Risk Management: The absolute drawdown is lower at $1,153.19, and the relative drawdown is also reduced to 14.80%, which indicates improved risk control compared to the earlier EA.
  4. Trade Efficiency: The average profit per trade has increased to $77.46, while the average loss per trade has also increased to -$62.07, showing larger individual trade gains and losses but overall higher profitability.
  5. Consecutive Trades: The maximum consecutive wins and losses suggest that the EA has periods of both winning and losing streaks, but the improved win rate and drawdown metrics indicate better overall stability.

Recommendations

  • Further Optimization: Even though this EA has improved metrics, further fine-tuning, especially in managing larger losses, could enhance performance.
  • Dynamic Adjustments: Consider incorporating dynamic stop loss and take profit settings to adapt to changing market conditions.
  • Diversification: Similar to the previous EA, testing on multiple symbols or timeframes could help reduce dependency on a single market condition.
Dall·e 2025 01 04 10.28.34   A Professional And Futuristic Trading Room, Showcasing A Clean And Modern Design, With A Wall Featuring Trading Monitors Displaying Complex Market Dat

sound like we need to specific only 1 option and Trading Option

You’re correct that having consistent global trading options (e.g., Friday Exit, session trading, etc.) across all strategies in your portfolio ensures better alignment and reduces potential conflicts. However, exits based on specific trade mechanics—like break-even (BE), trailing stops, partial close, or exit signals—are internal to each strategy and can add flexibility without necessarily breaking portfolio coherence. Here’s a detailed look:


1. Global Trading Options (Applied to All Strategies)

These options apply uniformly to every strategy in the portfolio and impact overall behavior. Examples include:

  • Exit on Friday: Ensures no positions are held over the weekend.
  • Session/Time Range Trading: Limits trading to specific hours or sessions, useful for aligning strategies with market activity.
  • Minimum/Maximum Trades Per Day: Controls frequency to manage risk exposure.

Impact on Portfolio

  • Consistency: All strategies adhere to the same rules, simplifying management.
  • Risk Control: Reduces unpredictability from holding positions outside preferred trading windows or volatile times.
  • Correlation Impact: Aligning global options can help avoid simultaneous trades that arise due to uncoordinated trading hours.

Best Practices

  • Use Exit on Friday for all strategies to mitigate weekend gap risks.
  • Set time ranges only if strategies target specific sessions (e.g., London Breakout).
  • Avoid mixing strategies with conflicting global options (e.g., one using Friday Exit, another not).

2. Strategy-Specific Exit Mechanisms

These exits are unique to each strategy and influence trade-level performance. Examples:

  • Break-Even (BE): Moves stop-loss to entry once a certain profit threshold is hit.
  • Trailing Stop: Dynamically adjusts the stop-loss to lock in profits.
  • Partial Close: Takes partial profit at predefined levels.
  • Exit Signal: Closes the trade based on a reversal or custom indicator signal.

Impact on Portfolio

  • Enhances Strategy Independence: Each strategy operates based on its internal logic, improving diversification.
  • Risk Management: Advanced exits like BE and trailing stops reduce drawdowns and lock in gains.
  • Potential Drawback: If exits are overly aggressive or poorly optimized, they might reduce the efficiency of profitable strategies.

Correlation Impact

Internal exits generally have minimal correlation impact unless:

  1. Strategies rely on identical exit logic and triggers (e.g., all use the same trailing stop settings).
  2. Exit signals consistently align, causing simultaneous closures across multiple strategies.

3. Combining Global Options with Internal Exits

Scenario 1: Unified Global Exit Rules

  • Example: All strategies use Friday Exit, and trading is limited to 8 AM–4 PM.
  • Internal Exits Allowed: BE, trailing stops, and exit signals are tuned per strategy.
  • Result: Balanced portfolio with consistent risk control and flexibility in individual strategies.

Scenario 2: Diverse Internal Exits

  • Example: Some strategies use aggressive trailing stops, while others rely on exit signals.
  • Result: Potentially more diversified outcomes, but monitor for conflicting behaviors (e.g., strategies exiting simultaneously due to correlated conditions).

4. Recommendations

  1. Global Options:
    • Use the same trading options (e.g., Friday Exit, session limits) across all strategies in the portfolio for consistency.
    • Align global options with your trading goals (e.g., avoiding weekend gaps or managing session-specific trades).
  2. Internal Exits:
    • Optimize exits like BE, trailing stops, and partial closes per strategy, as they are independent of portfolio-wide options.
    • Avoid overly aggressive exits unless they align with the strategy’s objective (e.g., scalping).
  3. Correlation Check:
    • Run correlation analysis after applying global options and internal exits to ensure portfolio diversification.
    • If multiple strategies show high correlation, consider adjusting exits or reducing overlap in their instruments/timeframes.

Final Thought

Global trading options ensure portfolio coherence, while internal exits provide strategy-specific flexibility. As long as global rules are harmonized and internal exits are carefully optimized, they won’t negatively impact the portfolio’s overall performance. Would you like a deeper dive into optimizing these exit strategies or analyzing correlations?


Dall·e 2024 12 31 10.11.07   A Professional Trading Room Designed To Emphasize Diversity And Innovation In Trading. The Room Features A Sleek Setup With Three Large Monitors Displ

Portfolio improving to use different TF/Instruments

Yes, when merging strategies into a portfolio in SQX, the global trading options such as “Exit on Friday” or “Limit Trading Range” apply to the merged portfolio as a whole. This means:

  1. Instrument Consistency:
    • You can mix strategies from different instruments (e.g., XAUUSD and AUDUSD), but only if the global trading options make sense across all instruments. If trading behavior (e.g., session times) differs greatly between instruments, it might create conflicts.
  2. Timeframe Variance:
    • You can merge strategies using different timeframes (e.g., M15 and H1). However, the portfolio may become harder to interpret, especially if the global settings (e.g., exit times or trading hours) affect strategies differently across timeframes.
  3. Strategy Options Alignment:
    • If individual strategies have specific settings that conflict with global options (e.g., one strategy relies on no-limit trading hours while another limits trading to the London session), the global options will override these.

Recommendations:

  • If you want to mix different instruments or timeframes, ensure their logic and performance are robust enough to handle global settings.

  • If strategies have critical unique options, avoid merging or build separate portfolios for each configuration.

Mixing different instruments and timeframes can create diversified and robust portfolios, but it must be done carefully to avoid conflicts or inefficiencies. Here’s a structured approach:


1. Key Considerations for Mixing Instruments

  • Instrument Correlation:
    • Aim to mix instruments with low or negative correlations. For example:
      • Good combinations: XAUUSD and AUDUSD (moderate correlation); USDJPY and GBPUSD (low correlation).
      • Risky combinations: EURUSD and GBPUSD (high correlation).
    • Tools: Use correlation analysis to confirm.
  • Trading Hours and Behavior:
    • Different instruments react to different trading sessions (e.g., XAUUSD active during London/NY, USDJPY active in Tokyo).
    • Avoid instruments with conflicting optimal trading ranges unless your global options align with all.
  • Cost Structure:
    • Ensure that trading costs (spreads, commissions, swaps) don’t disproportionately impact certain instruments.

2. Key Considerations for Mixing Timeframes

  • Complementary Timeframes:
    • Combine timeframes with complementary behavior:
      • Lower timeframes (M15, M30) for capturing short-term trends or scalps.
      • Higher timeframes (H1, H4) for broader trends and stability.
    • Avoid redundancy (e.g., M15 and M30 strategies doing similar trades).
  • Position Size & Risk Management:
    • Mixed timeframes can increase overlapping trades. Apply portfolio-level position sizing to manage overall risk.
  • Execution and Synchronization:
    • Ensure your backtesting and execution environment supports smooth transitions between timeframes without timing issues.

3. Portfolio Design Suggestions

Here’s how to structure and balance portfolios with mixed instruments and timeframes:

A. Single-Timeframe, Multi-Instrument Portfolio

  • Example: XAUUSD M15, AUDUSD M15, EURUSD M15.
  • Advantages: Easier to manage global options since all strategies share the same timeframe logic.
  • Challenges: Instruments with highly different characteristics may need different filters/settings.

B. Multi-Timeframe, Single-Instrument Portfolio

  • Example: XAUUSD M15, XAUUSD H1, XAUUSD H4.
  • Advantages: Focused on a single instrument’s behavior across timeframes. Robust to changes in volatility.
  • Challenges: Risk of over-concentration if XAUUSD trends or ranges unexpectedly.

C. Multi-Timeframe, Multi-Instrument Portfolio

  • Example: XAUUSD H1, EURUSD M15, USDJPY H4.
  • Advantages: Maximum diversification of signals, less exposure to a single market.
  • Challenges: Complexity in managing global options and synchronizing trades.

4. Workflow for Building Mixed Portfolios

  1. Validate Individual Strategies:
    • Test strategies on their respective instruments and timeframes. Use robust walk-forward validation.
  2. Correlation Analysis:
    • Measure historical correlations between strategies’ equity curves, not just instruments.
  3. Simulate Portfolio:
    • Combine strategies in SQX Portfolio Master and analyze:
      • Total return and drawdown.
      • Sharpe ratio, MAR, profit factor.
  4. Apply Global Options:
    • Ensure settings like “Exit on Friday” or “Limit Trading Range” make sense across all strategies.
  5. Monitor Overlap:
    • Watch for overlapping trades that could inflate risk or strain account margin.

Example Scenarios

Scenario 1: Balanced Portfolio

  • XAUUSD H1 (Trend-following).
  • EURUSD M15 (Mean reversion).
  • USDJPY H4 (Breakout).
  • Outcome: Well-diversified, different strategies complement each other.

Scenario 2: Aggressive Scalping

  • XAUUSD M15 (Scalping).
  • GBPUSD M5 (Scalping).
  • AUDUSD M15 (Scalping).
  • Outcome: High trade frequency, suitable for high-volatility periods, but riskier due to correlation.

5. Tools to Support Mixed Portfolios

  • Correlation Analysis Tools (available in SQX Portfolio Master).
  • Monte Carlo Simulations: Stress-test portfolio robustness with random sequence variations.
  • Walk-Forward Matrix: Ensure each strategy is robust independently before merging.

Key Advice

If what you’re doing aligns with these points—correlation analysis, managing global options, ensuring diversity—it’s on the right track. If you’re skipping global coherence checks or overloading similar strategies (e.g., scalping on correlated pairs), adjust your approach.

Dall·e 2024 12 31 09.36.43   A Professional And Visually Insightful Banner Image For An Article Titled 'buy At Support, Guard At Resistance—strategic Positioning.' The Design Feat

Buy at Support, Guard at Resistance—Strategic Positioning

A key principle in trading is understanding and leveraging support and resistance levels. These levels often act as psychological barriers, guiding price movements and helping traders make informed decisions.

  1. Buy at Support: Support levels are price zones where buying interest is strong enough to prevent further decline. These are ideal entry points as they often signal potential upward movement. Monitor the price action closely and plan your entry when the support level holds firm.
  2. Use Tight Stops Near Resistance: Resistance levels act as barriers where selling pressure tends to overpower buying interest. When approaching a resistance level, protect your position by placing tight stop-loss orders. This ensures that any abrupt reversal doesn’t lead to significant losses.
  3. React Quickly to Price Movement: If the price breaks through the resistance, you have the potential for a profitable trade. However, if the price begins to decline, exit the position without hesitation. The key is to minimize losses and protect your capital.

By combining discipline, quick decision-making, and an understanding of support and resistance dynamics, you can maximize opportunities and minimize risks. Remember, the market rewards those who act strategically, not emotionally.

Arch2

Projects ran out 12.24

Dall·e 2024 12 30 10.03.33   A Professional And Visually Striking Banner Image For An Article Titled 'don’t Try To Catch A Falling Knife—patience Pays.' The Design Features A Dram

Don’t Try to “Catch a Falling Knife”—Patience Pays

In trading, attempting to “catch a falling knife” is one of the most dangerous mistakes you can make. This term describes the risky act of buying into a sharp decline, hoping to catch the exact bottom of a price drop. More often than not, this approach leads to further losses, as prices can continue to plummet.

Instead, adopt a more disciplined and patient strategy. Allow the market to stabilize and show signs of recovery. Here’s how you can do it:

  1. Observe the Initial Drop: Let the price decline fully. Avoid impulsively entering during the fall.
  2. Wait for a Strong Bounce Back: A sharp rebound often follows a dramatic drop. However, this bounce might not be sustainable.
  3. Monitor the Retest of Lows: Watch as the price returns to the previous low. If it holds above the prior low, it could indicate that the market is forming a bottom.
  4. Plan Your Entry Strategically: Only consider opening a position once the price confirms a stable support level and begins to rise again.

This patient approach protects your capital and ensures you’re entering the market at an optimal time. If the price doesn’t recover as expected, let it go. There will always be other opportunities in the market.

By waiting for confirmation and not trying to force a trade, you increase your chances of success while avoiding unnecessary risks. Remember, it’s better to miss a potential bottom than to suffer significant losses by entering too early.