DNYL . SPACE

As motivation plays a crucial role in reaching these goals.

Author: admin

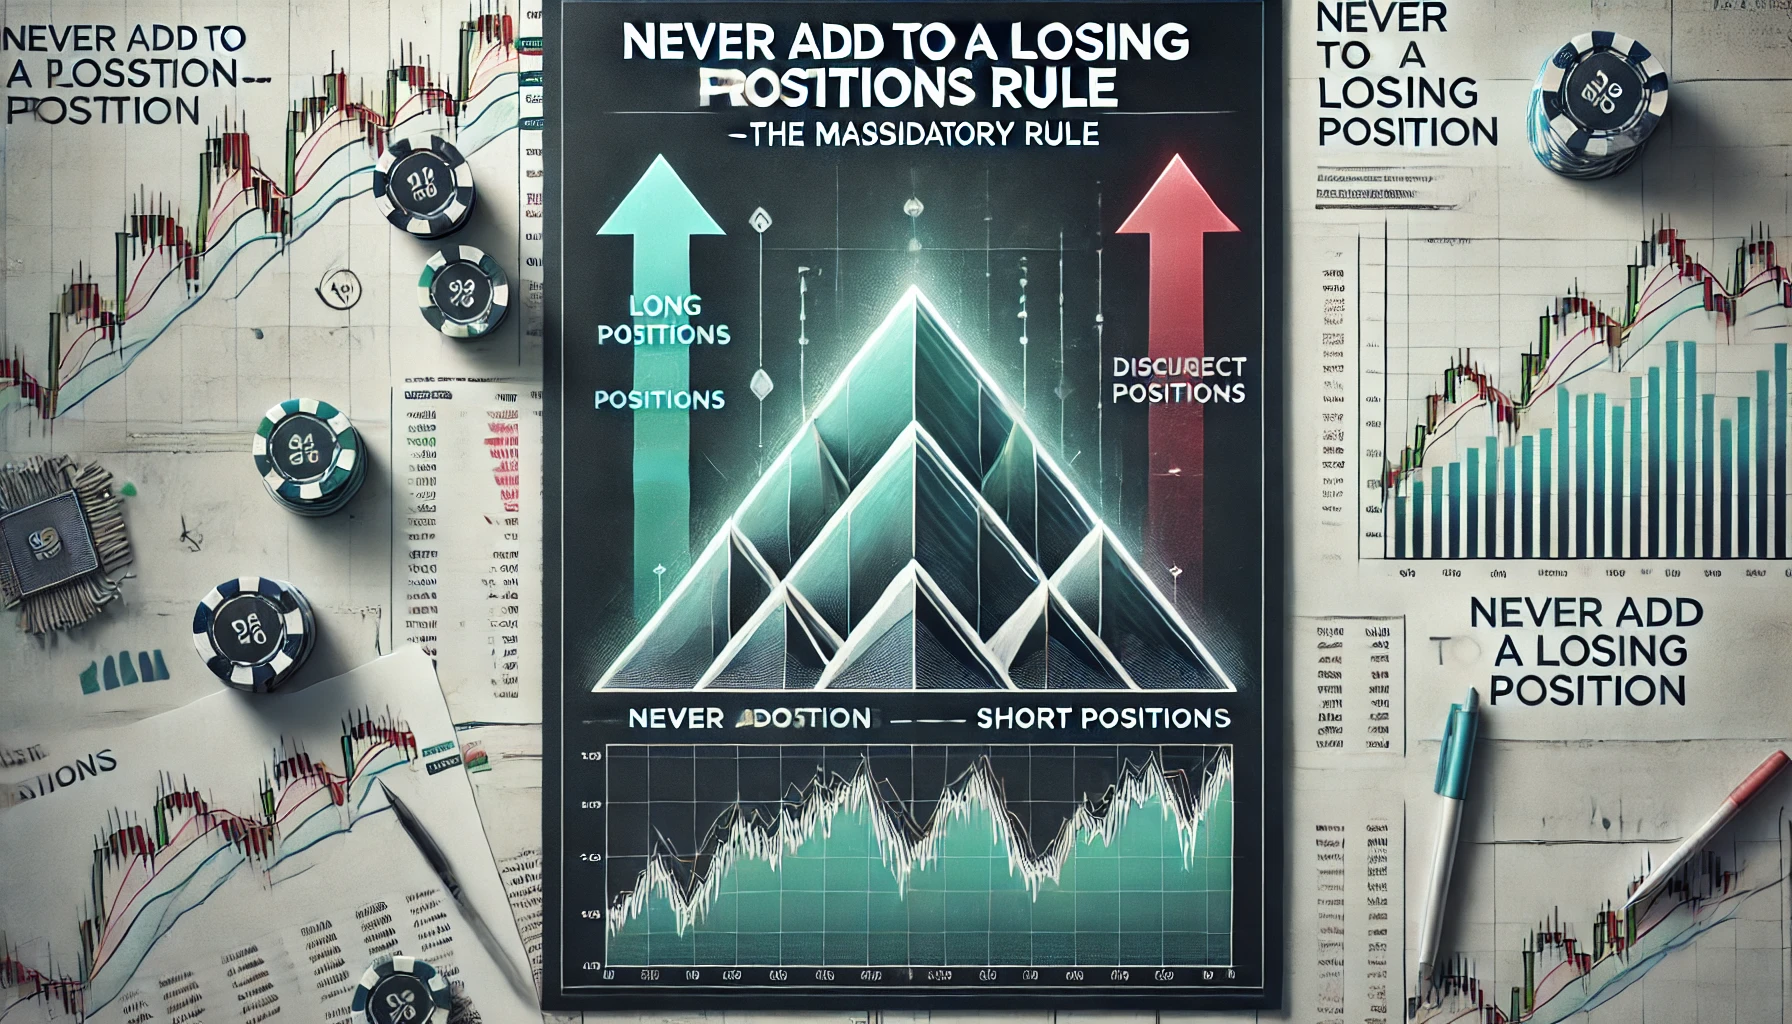
Dall·e 2024 12 27 09.39.28   A Professional And Clear Banner Image For An Article Titled 'never Add To A Losing Position—the Mandatory Rule.' The Design Features A Pyramid Structu

Never Add to a Losing Position—The Mandatory Rule

()
HomePage 2

One of the most critical rules for traders is to avoid the temptation of adding to a losing position. It might seem like an opportunity to “average down” or reduce the overall cost of your position, but this strategy often leads to compounding losses and greater emotional and financial stress.

Instead, adopt the disciplined approach of building a pyramid with your positions. When going long, ensure that each new purchase is made at a higher price than the previous one. This indicates that the market is confirming your trade idea by moving in the expected direction. Conversely, when adding to a short position, ensure that each new sale is executed at a lower price than the previous one.

This method not only aligns your trades with the prevailing trend but also ensures you are not throwing good money after bad. By following this mandatory rule, you prevent the emotional trap of holding onto and doubling down on losing trades, which can lead to significant capital erosion.

Remember, successful trading is about managing risk, not chasing losses. If your initial position is losing, accept the loss, reassess the market, and wait for the next opportunity. Adding to a losing trade only increases your exposure to an already unfavorable situation, which can quickly spiral out of control.

This rule emphasizes discipline, strategy, and the importance of staying aligned with market momentum. It protects your capital and keeps you in a position to capitalize on favorable trends when they occur.

Arch1

Projects ran out 11.24

()
HomePage 2


Dall·e 2024 12 26 10.25.13   A Professional And Visually Structured Banner Design Featuring A Clean And Modern Layout, Incorporating Five Distinct Filter Pairs For Maximum Efficie

This pairing will help reduce the amount of EA and save time

()
HomePage 2

So give me re-arrange 5 pairs like this without duplicating filters for maximum efficiency.

Sure! Here are five pairs of filters arranged for maximum efficiency, ensuring no duplicates across the selections:

Filter Pairs

  1. Pair 1:
    • First Filter (IS): Sharpe Ratio
    • Second Filter (OOS): Net Profit
  2. Pair 2:
    • First Filter (IS): CAGR/Max DD%
    • Second Filter (OOS): Profit Factor
  3. Pair 3:
    • First Filter (IS): Stability
    • Second Filter (OOS): Consecutive Win/Loss
  4. Pair 4:
    • First Filter (IS): Ret/DD Ratio
    • Second Filter (OOS): Open DD%
  5. Pair 5:
    • First Filter (IS): Max DD%
    • Second Filter (OOS): R-Squared

Summary

  • Each pair consists of one metric from the Importance Score (IS) category and one from the Out-of-Sample (OOS) category, ensuring no duplicates. This setup will help you efficiently narrow down your EA selection while covering various critical performance aspects.


Here are the recommended filter settings parameters for each pair to help you refine your EA selection process effectively:

Filter Settings Parameters

  1. Pair 1:
    • IS: Sharpe Ratio
      • Setting: Minimum Sharpe Ratio (e.g., > 1.5)
    • OOS: Net Profit
      • Setting: Minimum Net Profit (e.g., > $1,000 or a percentage of capital)
  2. Pair 2:
    • IS: CAGR/Max DD%
      • Setting: Minimum CAGR/Max DD% ratio (e.g., > 1.5)
    • OOS: Profit Factor
      • Setting: Minimum Profit Factor (e.g., > 1.5)
  3. Pair 3:
    • IS: Stability
      • Setting: Minimum Stability (e.g., > 0.8)
    • OOS: Consecutive Win/Loss
      • Setting: Maximum Consecutive Losses (e.g., < 3)
  4. Pair 4:
    • IS: Ret/DD Ratio
      • Setting: Minimum Ret/DD Ratio (e.g., > 1.5)
    • OOS: Open DD%
      • Setting: Maximum Open Drawdown Percentage (e.g., < 15%)
  5. Pair 5:
    • IS: Max DD%
      • Setting: Maximum Drawdown (e.g., < 20%)
    • OOS: R-Squared
      • Setting: Minimum R-Squared (e.g., > 0.6)

Summary of Settings

  • Each pair is designed with specific thresholds to ensure you select EAs that meet your performance criteria. You can adjust the numerical values based on your risk tolerance and trading goals. These settings will help you focus on strategies that are likely to perform well while managing risk effectively.

Dall·e 2024 12 23 16.05.18   A Professional And Visually Appealing Banner Image For Financial Trading Strategy Filtering Methods. The Banner Should Feature Two Distinct Paths Or A

Topic-Based Filter VS. Mixed Criteria Filter #1

()
HomePage 2
I apply a topic based filter here, sorting by the best IS, followed by the best OOs in that topic. The result is in the topic @Expert Advisor Performance Review Or do I apply a topic based filter by IS, followed by OOs that focus on something unrelated to the main topic? For example, filtering for the best Stability IS, followed by the second best Profits Factor or Cagr/dd%?
It sounds like you’re considering two different approaches to filtering your strategies. Here’s a breakdown of both methods:

  1. Topic-Based Filter:

    • Sort by the best IS (Importance Score) in a specific topic first, followed by sorting by the best OOs (Out-of-Sample performance) within that same topic.
    • This approach ensures that you focus on strategies that are not only well-ranked within the same criteria but also relevant to a specific trading theme or topic. It can help you build a coherent portfolio centered on a particular strategy style or market condition.
  2. Mixed Criteria Filter:

    • Filter by the best Stability IS, followed by the second-best Profit Factor or CAGR/Max DD% that may not necessarily relate to the initial Stability topic.
    • This approach allows for more diversification in your selection process, potentially leading to a more balanced portfolio. It could help in identifying strategies that excel in different areas, even if they are not directly related.

Recommendation:

  • If your goal is to create a focused portfolio centered on a specific trading philosophy or market condition, the first method (topic-based filter) is likely more effective.

  • If you aim to have a diverse portfolio with strategies excelling in various performance metrics, the second method (mixed criteria filter) would be beneficial.

Consider your overall strategy and objectives when deciding which filtering method to apply…

If you’re opting for the Mixed Criteria Filter with one selection for each filter, you can prioritize the metrics based on what is most critical for your trading strategy. Here’s a suggested approach:

  1. First Filter (IS): Choose the metric that aligns best with your trading goals and risk tolerance. Here are a few options:
    • Sharpe Ratio: This is a solid choice if you want to focus on risk-adjusted returns. A higher Sharpe Ratio indicates better returns for the level of risk taken.
    • CAGR/Max DD%: If you’re particularly concerned about long-term growth relative to drawdown, this metric provides insight into the strategy’s growth potential while considering drawdown risk.
    • Profit Factor: This metric helps to assess how much profit a strategy makes compared to its losses. It’s useful if you want to ensure the strategy is consistently profitable.

    Recommended Choice: Sharpe Ratio – It gives a comprehensive view of risk-adjusted performance, which is crucial for evaluating trading strategies.

  2. Second Filter (OOS): This filter will provide insights into the strategy’s out-of-sample performance. Choose the metric that best reflects your priorities for OOS evaluation:
    • Net Profit: This is straightforward and gives a clear view of overall profitability.
    • Consecutive Win/Loss: If you’re focused on stability and consistency, this metric can highlight how often the strategy wins or loses in succession, which might be important for managing psychological aspects of trading.

    Recommended Choice: Net Profit – It provides a clear indicator of how well the strategy performs in real-world conditions beyond backtesting.

Summary of Selections:

  • First Filter (IS): Sharpe Ratio
  • Second Filter (OOS): Net Profit

This combination should help you identify robust strategies that are not only effective in backtesting but also demonstrate solid performance in out-of-sample evaluations.

Dall·e 2024 12 23 15.49.23   A Professional And Motivational Banner Image For An Article Titled 'always Protect Your Capital—the Golden Rule Of Trading.' The Design Features A Shi

Always Protect Your Capital—The Golden Rule of Trading

()
HomePage 2

The number one rule for long-term success in trading is to protect your capital at all costs. Without capital, there is no opportunity to trade, learn, or recover from mistakes. This is why capital preservation must take precedence over everything else.

Losses are inevitable in trading, but how you handle them makes all the difference. The key is to keep losses small and quick. Do not dwell on small losses—they are part of the game and an essential aspect of risk management. It’s far better to accept a minor loss early than to endure the psychological stress of holding onto a losing position in the hope of recovery.

Being intolerant of losses does not mean avoiding them altogether—it means being disciplined enough to cut them early. When losses are trimmed before they grow, you not only preserve your capital but also maintain a clear mindset to analyze and act on new opportunities.

A vital aspect of this rule is total risk management. This involves setting strict stop-loss levels, maintaining a diversified portfolio, and only risking a small percentage of your capital on any single trade. By limiting exposure and consistently applying risk controls, you ensure that no single loss can significantly damage your overall position.

The true test of a trader is not how much they win but how well they manage losses. Small, controlled losses are the foundation of a resilient trading strategy, allowing you to stay in the game and capitalize on future opportunities. Protect your capital fiercely—it is your most valuable asset.

Dall·e 2024 12 22 12.50.36   A Sleek And Professional Banner Image For An Article Titled 'ride The Trend With Trailing Stops.' The Design Features A Stock Chart With A Highlighted

Ride the Trend with Trailing Stops

()
HomePage 2

When the market is moving in your favor, one of the most effective strategies to maximize profits and minimize losses is using trailing stops. These dynamic stop-loss levels allow you to lock in gains as the trend continues while protecting your position from significant reversals.

A trailing stop can be set as a fixed percentage of the current market price—typically around 10-15%—or at key technical levels, such as recent highs or lows, or existing support and resistance zones. By placing these stops mentally or within your trading platform, you ensure your position adjusts naturally with market movements.

The beauty of trailing stops lies in their adaptability. As the price moves favorably, you can adjust your stop-loss level incrementally, maintaining a safe buffer while securing profits. This eliminates the emotional dilemma of when to exit, as your exit strategy is predefined and responsive to the market’s behavior.

Using trailing stops also helps you avoid two common pitfalls: exiting too early out of fear or holding on too long and watching profits evaporate. They encourage a disciplined approach, allowing you to let the trend run its course while ensuring you don’t give back too much of your gains.

To enhance this strategy, regularly review and correct your target levels based on new market conditions or emerging patterns. If the market breaks through a key resistance or support level, adjust your trailing stop to reflect the new potential range.

In summary, trailing stops are a powerful tool to manage trades effectively in trending markets. They provide the flexibility to stay in winning trades longer while protecting against sudden reversals, helping you achieve consistent success as a trader.

Dall·e 2024 12 22 12.46.08   A Professional And Visually Structured Banner Design Tailored For A Financial Trading Context. The Image Features An Abstract Representation Of Tradin

SQX and FTMO setup #3 – Incorporate these elements

()
HomePage 2

To incorporate these elements into your SQX setup for handling maximum drawdown effectively, here are the specific parameters and considerations:

1. Portfolio Diversification:

  • Multi-Strategy Approach: In SQX, build and test different strategies that target various market conditions (e.g., trend-following, breakout, mean-reversion). This diversification helps balance drawdowns since each strategy may perform differently during various market phases.
  • Asset Selection: Include other assets besides XAUUSD if feasible, such as major currency pairs, to spread risk and reduce correlation.
  • Correlation Analysis: Use SQX’s built-in tools to analyze the correlation between strategies. Select a mix with low correlations to ensure the portfolio’s drawdown is less affected by any single market movement.

2. Regular Monitoring:

  • Backtesting and Walk-Forward Analysis: Regularly backtest and run walk-forward optimization to see how drawdown patterns evolve over different timeframes. This ensures strategies are resilient and maintain drawdowns below the 10% threshold.
  • Out-of-Sample Testing: Test strategies with out-of-sample data to confirm they perform well beyond just in-sample data, helping to validate their robustness in managing drawdown.
  • Monte Carlo Simulations: Utilize Monte Carlo analysis in SQX to stress test strategies under various market conditions, identifying those with a consistent maximum drawdown below the desired level.

3. Adaptive Stop Loss:

  • ATR-Based Stop Loss: In SQX, configure adaptive stop losses based on a multiple of the ATR (e.g., 1.5x-2x). This makes the stop loss dynamic and better suited to market conditions, allowing trades to have room during high volatility while tightening in calm periods.
  • Trailing Stop Loss: Implement a trailing stop loss feature that follows the price as it moves in your favor. Use a percentage of the ATR or a fixed percentage (e.g., 1%) that updates as the price increases.
  • Break-Even Adjustments: Set rules for moving the stop loss to break-even after the trade has gained a certain number of pips or a percentage of the ATR. This reduces the risk of a profitable trade turning into a loss.

SQX Parameter Settings for Maximum Drawdown Control:

  • Maximum Drawdown Filter: Configure the “Max Drawdown” filter during strategy generation to discard any strategy that shows a drawdown over 10% in backtests.
  • Risk Control Rule: Add a rule that limits the number of open trades or caps exposure based on total equity or margin.
  • Trailing Stop Mechanism: Set up rules in the strategy logic for trailing stops that trigger once a predefined profit threshold is reached (e.g., trailing starts at 1 ATR profit).
  • Portfolio Drawdown Limitation: Use SQX Portfolio Master to set an equity stop for the portfolio, ensuring the combined strategies don’t push drawdown above 10%.

By using these techniques and parameters, you create a structured approach to control drawdown effectively, ensuring strategies are optimized for real-world trading and compliant with risk management standards like those required for FTMO.

Leonardo Lightning Xl Fusion Of Elements The Meeting Point Wh 1

Fusion of Elements EA

()
HomePage 2

Here’s a detailed analysis of the performance of the Fusion of Elements EA for XAUUSD (Gold) on the M30 timeframe based on the provided Strategy Tester Report:


Profitability

  1. Total Net Profit:
    • The net profit of $69,382.24 from a starting deposit of $5,000 is moderate, but the profitability is less impressive compared to other EAs in your portfolio.
    • The Profit Factor of 1.52 (gross profit $202,493.56 vs. gross loss $133,111.32) suggests the EA generates a modest edge in profitability.
  2. Expected Payoff:
    • An expected payoff of $8.37 per trade is relatively low, highlighting a dependence on trade volume for overall profitability.
  3. Winning and Losing Trades:
    • The EA has a win rate of 38.25%, which is significantly lower than the other EAs analyzed.
    • Despite a low win rate, the average profit trade ($63.90) is larger than the average loss trade (-$26.01), which partially offsets the frequent losses.
  4. Largest Trades:
    • The largest profit trade was $1,252.96, slightly larger than the largest loss trade of -$1,053.60, reflecting limited variance between extreme wins and losses.

Risk and Drawdown

  1. Absolute and Maximal Drawdown:
    • Absolute drawdown: $2,585.24 — moderate but notable given the modest profits.
    • Maximal drawdown: $5,099.48 (8.75%) shows acceptable risk levels but requires careful monitoring.
    • The Relative drawdown of 57.85% indicates significant periods of equity drawdowns, which could deter risk-averse traders.
  2. Risk per Trade:
    • The EA suffered 25 consecutive losses but kept financial damage minimal at -$259.50 during the streak.
    • The largest consecutive loss series incurred -$1,976.40 over 2 trades, suggesting occasional spikes in risk exposure.

Efficiency

  1. Trade Frequency:
    • Executed 8,286 trades over the backtest period, averaging around 2.8 trades per day, leveraging high-frequency trading on the M30 timeframe.
  2. Consistency:
    • The longest winning streak was 12 trades (profit $163.06), showing limited streak potential.
    • The EA averages 2 consecutive wins versus 3 consecutive losses, reflecting a challenging balance between gains and losses.

Key Observations

  1. Profitability vs. Drawdowns:
    • The EA achieves profits, but the low win rate and high relative drawdown raise concerns about sustainability, particularly in volatile markets.
  2. Trade Quality:
    • While profitable trades significantly outweigh loss trades in size ($63.90 vs. -$26.01), the low win rate (38.25%) makes overall performance less reliable.
  3. Scalability:
    • The EA’s performance may struggle with larger lot sizes due to the relatively high relative drawdown and modest profit factor.
  4. High-Frequency Trading Dependency:
    • With over 8,000 trades, the EA relies heavily on high-frequency trading, which increases sensitivity to spreads, slippage, and trading costs.

Recommendations for Optimization

  1. Improve Entry Criteria:
    • Review the entry logic to improve the win rate and reduce the high number of loss trades (61.75%). Refinements could involve adding filters for market conditions or time-of-day optimizations.
  2. Enhance Risk Management:
    • Reduce the impact of consecutive loss streaks by implementing tighter stop-loss controls or diversifying risk across multiple setups.
  3. Reduce Drawdowns:
    • Focus on minimizing the relative drawdown (57.85%), which could be achieved by adjusting position sizing or improving exit strategies during adverse market conditions.
  4. Optimize Trade Frequency:
    • Reevaluate the trading frequency to balance quality over quantity, as the current volume of trades may reduce net profitability due to transaction costs and slippage.
  5. Test Under Realistic Conditions:
    • Since the backtest used the Control Points model (a crude method), it is critical to retest the EA using Every Tick modeling for more accurate and reliable results.

Final Verdict

The Fusion of Elements EA demonstrates moderate profitability with acceptable drawdowns but is hindered by a low win rate, high relative drawdown, and dependency on high-frequency trading. While it generates consistent gains, it is less robust than other EAs in your portfolio. With strategic optimizations and more precise backtesting, this EA could see improved performance. However, its current risk-reward profile may not appeal to conservative traders or those seeking smoother equity curves.

Dall·e 2024 12 16 15.51.42   A Professional And Visually Appealing Banner Image Designed For Forex Traders Preparing For The Ftmo Challenge. The Design Features A Financial Theme

Adapting and Understanding some Popfirm rules

()
HomePage 2

To help you optimize for the FTMO challenge, here are detailed points addressing your questions:

  1. Daily Loss Limit (5%):
    • Trade Sizing: Structure your trade sizes so that no single trade or group of trades taken on the same day exceeds 2-3% of the account. This buffer can help you stay within the 5% limit even in the worst-case scenario.
    • Stop Loss Placement: Always use stop losses to cap the potential loss on each trade. Ensure that cumulative risk from open positions stays well within the daily loss limit.
    • Limit Daily Exposure: Use a daily trading plan that sets a cap on the number of trades or risk exposure for the day, helping prevent overtrading.
  2. Maximum Drawdown (10%):
    • Portfolio Diversification: Build a diversified strategy set to spread risk across uncorrelated assets or strategies.
    • Regular Monitoring: Use SQX to simulate and monitor drawdown patterns during backtesting and select strategies with a maximum drawdown comfortably below the 10% threshold.
    • Adaptive Stop Loss: Implement dynamic stop losses or trailing stops that adjust based on market volatility to protect gains and reduce drawdown.
  3. Risk Management:
    • Fixed Fractional Position Sizing: Risk a fixed percentage (e.g., 0.5%-1%) of your account on each trade to limit potential losses without stifling profit potential.
    • Break-Even Stops and Trailing Stops: Use break-even stops to remove risk after a trade moves in your favor and trailing stops to lock in profit as it continues.
    • Multiple Timeframe Analysis: Use higher timeframes for trend direction and lower ones for entry, optimizing entry points and reducing the chance of high drawdowns.
  4. Consistency:
    • Robust Backtesting and Optimization: Use SQX to test strategies across various time periods and ensure they perform consistently, not just in one market condition. Utilize out-of-sample testing to confirm stability.
    • Trade Filters: Apply filters based on volatility, trend strength (e.g., ADX or Moving Average slopes), or other market conditions to prevent trading in suboptimal periods.
    • Maintain Simplicity: Avoid overfitting by keeping strategy rules straightforward and logical.
  5. Adapting to Different Market Conditions:
    • Volatility-Based Adjustments: Incorporate volatility measures such as ATR to adapt stop loss and take profit levels according to market conditions.
    • Multi-Strategy Approach: Combine trend-following, mean-reversion, and breakout strategies to cover various market phases.
    • Monitoring Correlations: Regularly check correlations between strategies or instruments to avoid compounding risk when market conditions change.
  6. Position Sizing:
    • Dynamic Sizing: Adjust position size based on current account equity and market volatility. This can be done using ATR-based sizing to ensure that each position aligns with your risk tolerance.
    • Scaling In and Out: Gradually scale into trades to mitigate entry risk and scale out to lock in partial profits, balancing risk and reward.
  7. Stop Loss Placement:
    • ATR-Based Stops: Use a multiple of ATR (e.g., 1.5-2x ATR) to set a stop loss that adapts to current market volatility, allowing enough room for price fluctuations.
    • Technical Levels: Place stops beyond key support/resistance or Fibonacci levels to avoid being stopped out prematurely.
    • Time-Based Stops: Consider using time-based exits in combination with price-based stop losses to limit exposure during uncertain market periods.

These strategies and tips can help you meet FTMO’s trading rules while optimizing for profitability and risk management.

Dall·e 2024 12 16 15.13.45   A Professional And Insightful Banner Image For An Article Titled 'high Volume Ends Trends—beware The Climax Moves.' The Design Features A Stock Chart

High Volume Ends Trends—Beware the Climax Moves

()
HomePage 2

In trading, volume is a critical indicator of market sentiment, and extreme volume often signals the end of a prevailing trend. When the market experiences a climactic rise or an excessively strong collapse, the existing trend can be disrupted, leading to a period of indecision and consolidation.

High-volume moves, whether a sharp rally or a steep sell-off, often occur when emotions like fear or greed dominate. Buyers or sellers rush in, leading to an exhaustion of momentum. This phenomenon throws both sides—those who chased the move and those who hesitated—out of the market.

Following these breakouts, the market frequently transitions into a sideways phase. Traders may see this as a period of uncertainty, where price movements are less directional and volatility often decreases. These consolidation phases can be opportunities to reset your strategy, watch for new patterns, and prepare for the next significant trend.

For traders, recognizing climactic volume events is crucial. Instead of being caught off guard, anticipate that high volume can signal a reversal or the start of a consolidation phase. Avoid entering new positions during these moments unless your strategy specifically accounts for such volatility.

This rule highlights the importance of patience and observation. By understanding that extreme volume often disrupts trends, you can protect your capital, avoid unnecessary risks, and position yourself to take advantage of the market’s next move.

Dall·e 2024 12 16 14.58.44   A Professional And Visually Appealing Banner Image Designed For Forex Traders And Strategy Developers. The Image Showcases A World Map Highlighting Co

Which country in GMT+2 or +3 near LONDON or New York?

()
HomePage 2

Countries in the GMT+2 or GMT+3 time zones that are relatively closer to London or New York include:

GMT+2:

  • Central European countries:
    • Greece
    • Bulgaria
    • Cyprus
    • Romania
    • Finland (most parts)
  • Africa:
    • Egypt
    • South Africa (during daylight saving)

GMT+3:

  • Eastern Europe and West Asia:
    • Turkey
    • Belarus
    • Russia (western parts like Moscow)

my forex’s broker placed a server in London and New York and Trading platform time is the time that the MetaTrader 4 or MetaTrader 5 platform charts and data are set in. VT Markets trading server time is set to GMT+2 OR GMT+3 depending on the daylight savings.

From your description and the provided screenshot, VT Markets adjusts the trading platform’s time to GMT+2 or GMT+3 depending on daylight savings.

To align the SQX data history and ensure accurate matching with VT Markets’ server time, you should use the following:

  • GMT+2 (European DST: Yes) when daylight savings is active.
  • GMT+3 (European DST: Yes) during the period when daylight savings is not active.

Why?

VT Markets follows the same logic as European Daylight Saving Time, where:

  • GMT+2 is used during Standard Time (winter months).
  • GMT+3 is used during Daylight Saving Time (summer months).

If your trading platform automatically adjusts for DST, selecting an option labeled European DST: Yes ensures the SQX data history aligns perfectly with the broker’s trading server time.


and this’s info from IC Market; “To align the daily chart candles with New York close (5pm ET), IC Markets Global’s server time and charts are GMT+2 or GMT+3 when daylight saving is in effect. The table below outlines the dates on which the server time is changed to reflect daylight savings each year. ” does it same VT Market ?

Yes, IC Markets Global’s server time setup is the same as VT Markets in this case. Both brokers align their trading platforms with New York close (5 PM ET) and use:

  • GMT+2 during Standard Time (winter).
  • GMT+3 during Daylight Saving Time (summer).

This means their trading platform times adjust to follow Eastern Time (ET) daylight saving changes.

Why do brokers use this setup?

This configuration ensures that daily candles on platforms like MetaTrader 4/5 reflect a full 24-hour trading day, starting and ending at 5 PM New York time, which is the standard close for the forex trading day globally.

Conclusion:

Yes, IC Markets and VT Markets share the same time setup for trading platforms. If you’re configuring SQX data history for IC Markets or VT Markets, you should use GMT+2 or GMT+3, depending on the daylight saving period, as you would for both brokers.


i use EET timezone its oki ?

Yes, using EET (Eastern European Time) is perfectly fine because:

  • EET corresponds to GMT+2 during Standard Time (winter months) and GMT+3 during Daylight Saving Time (summer months).
  • This matches the server times used by both VT Markets and IC Markets, as they align their platforms to New York close (5 PM ET).

Key Points:

  • EET = GMT+2 in Standard Time (winter).
  • EET = GMT+3 in Daylight Saving Time (summer).

By using EET, your time zone configuration will be synced with the brokers’ server times, ensuring your trading data, daily candles, and SQX history are correctly aligned.
 

Getimg Ai Img On0vsfukx9xdr4auejy9d (1)

Forge of Ideas EA

()
HomePage 2

Here’s a detailed analysis of the performance of the Forge of Ideas EA for XAUUSD (Gold) on the H1 timeframe:


Profitability

  1. Total Net Profit:
    • Achieving $160,843.87 in net profit from an initial deposit of $5,000 over the testing period indicates a healthy return.
    • The Profit Factor of 1.73 (gross profit of $380,464.07 vs. gross loss of $219,620.20) reflects solid profitability with a balanced risk-return tradeoff.
  2. Expected Payoff:
    • The expected payoff of $20.52 per trade is moderate but in line with the high number of trades executed.
  3. Winning and Losing Trades:
    • The system has a win rate of 57.88%, with average profit per trade ($83.84) slightly higher than the average loss per trade (-$66.51).
    • This balance between win rate and trade size helps the EA maintain profitability.
  4. Largest Trades:
    • The largest profit trade was $3,959.52, while the largest loss trade was -$994.26, demonstrating an effective risk-reward ratio with the largest win approximately 4x the size of the largest loss.

Risk and Drawdown

  1. Absolute and Maximal Drawdown:
    • Absolute drawdown: $1,217.94 — very low compared to the initial deposit, showing strong capital preservation.
    • Maximal drawdown: $4,712.61 (3.85%) is excellent, showcasing controlled risk relative to profitability.
    • However, the relative drawdown of 35.80% indicates occasional equity dips that require monitoring.
  2. Risk per Trade:
    • The largest consecutive losses occurred over 17 trades, but the financial impact was well-contained (-$590.09).
    • The largest loss series was $2,095.64 over 10 trades, indicating a relatively mild equity draw even in clustered losses.

Efficiency

  1. Trade Frequency:
    • Executed 7,840 trades over the test period, averaging about 2.2 trades per day, which aligns well with the H1 timeframe.
  2. Consistency:
    • The longest winning streak was 25 trades (profit $3,295.56), and the largest consecutive profit streak yielded $6,321.47 over 10 trades.
    • The system averages 4 consecutive wins vs. 3 consecutive losses, reflecting a tendency toward positive outcomes over time.

Key Observations

  1. Profitability vs. Trade Volume:
    • The EA relies on frequent trades and a moderate win rate (57.88%) to generate its overall profit. The balance between trade frequency and average trade size appears to be well-calibrated.
  2. Controlled Drawdowns:
    • The maximum drawdown of 3.85% in absolute terms is one of the lowest observed in similar EAs, making this system suitable for traders prioritizing capital preservation.
  3. Scalability:
    • With a high trade count and a low average drawdown, the strategy appears scalable for larger initial deposits without a significant increase in risk.
  4. Risk-Reward Ratio:
    • The system effectively caps losses while allowing winning trades to run longer, as evidenced by the disparity between the largest profit and largest loss trades.

Recommendations for Optimization

  1. Improve Expected Payoff:
    • While the strategy generates solid profits, refining entry or exit criteria to improve the expected payoff per trade could enhance returns without increasing risk.
  2. Refine Risk Management:
    • Although drawdowns are well-managed, reducing the relative drawdown (35.80%) could add stability, particularly during adverse market phases.
  3. Analyze Losing Streaks:
    • Review the EA’s behavior during extended loss streaks to identify patterns or market conditions that may require improved filtering mechanisms.
  4. Test for Robustness:
    • Conduct tests under varying market conditions, spreads, and slippage to ensure the system remains reliable in live environments.
  5. Leverage Optimization:
    • Dynamic position sizing based on equity growth could improve scalability and profitability while maintaining low drawdown levels.

Final Verdict

The Forge of Ideas EA is a strong performer with robust profitability, consistent trade outcomes, and low drawdowns. Its ability to maintain stability while executing frequent trades makes it a suitable option for traders seeking consistent returns with limited risk exposure. Further optimizations could enhance its performance, especially in terms of expected payoff per trade and drawdown management, without compromising its overall reliability.

Dall·e 2024 12 15 16.56.52   A Sleek And Professional Banner Image For An Article Titled 'understand Market Reactions—there's Always A Second Boat.' The Design Features A Metaphor

Understand Market Reactions—There’s Always a Second Boat

()
HomePage 2

Markets operate on patterns of behavior, driven by human emotions like fear and greed. One of the most reliable dynamics is the crowd of traders who feel they’ve “missed the first boat.” These participants, who didn’t act during the initial move, often jump in during subsequent reactions, creating opportunities for savvy traders to capitalize.

When the market experiences its first sell-off after a strong rally, it typically attracts buyers who view the dip as an opportunity to enter. Conversely, the first rally following a sharp decline often tempts sellers looking to exit or short the market. These reactions are usually temporary, representing moments of hesitation or indecision rather than a shift in the overall trend.

As a trader, you can plan your strategy around these predictable reactions. When a stock or market reaches a new high and then pulls back, the first bounce off that high often offers a low-risk buying opportunity. Similarly, the first bounce after a market reaches a new low can present a prime moment to sell or short.

This rule emphasizes the importance of timing and planning. Observing market behavior during these reaction phases allows you to align your trades with the prevailing trend, rather than acting impulsively. It’s not about chasing the move but about anticipating how the crowd will react and positioning yourself strategically.

By understanding these patterns, you can avoid being part of the reactive crowd and instead act as a proactive trader. Patience and analysis are key—wait for the market to reveal its intentions and use these moments to your advantage.

Dall·e 2024 12 15 13.24.07   A Professional And Visually Structured Banner Image For Trading Strategy Analysis On Xauusd (gold) Performance, Highlighting The Importance Of The 200

Time and History passed, Just worried

()
HomePage 2

In backtesting against 20 years of gold data, if my cost is around $1000, should I be concerned with the 2003-2010 period, since gold prices were significantly different after 2010, or should I add more cost for this test?

When backtesting against 20 years of gold data with a cost of $1000, the period from 2003 to 2010 warrants special attention for a few reasons:

Why Focus on 2003–2010?

  1. Market Regime Change:
    • Gold underwent a major bull market during 2003–2010, rising from approximately $300 to over $1200 by the end of the period.
    • After 2010, gold experienced new price regimes, including the 2011 peak and subsequent corrections. These changes may mean that strategies working well before 2010 might fail in later, more volatile markets.
  2. Cost Significance:
    • A $1000 cost might have represented a larger relative percentage of the price during 2003–2010 (e.g., around 5%-10% of gold’s price) compared to post-2010 periods when gold prices have often been above $1500.
  3. Volatility Differences:
    • The volatility structure of gold has evolved over time. Pre-2010, trends were stronger and more directional, while post-2010 has seen more erratic and range-bound movements.

Should You Be Concerned?

Yes, you should carefully evaluate this period because:

  1. Disproportionate Impact:
    • If a strategy heavily depends on the trends of 2003–2010, its robustness in post-2010 periods (with more range-bound action) could be in question.
    • Costs may have a larger impact on profitability for strategies built in this regime compared to more recent data.
  2. Regime Bias:
    • A strategy optimized for pre-2010 conditions may overfit to that regime and not generalize well for the flatter periods seen later.
  3. Risk of Misleading Results:
    • Even if the backtest shows strong performance overall, the pre-2010 period may dominate the results due to high trends and low relative costs.

Adjusting Costs for Realism

To ensure realistic testing:

  • Increase the Cost:
    • You can apply a scaled transaction cost to simulate the higher relative impact of costs during periods when gold prices were lower. For example:
      • Use a percentage-based cost relative to price (e.g., 0.2% of the price per trade) instead of a fixed $1000.
    • Alternatively, segment the backtest into multiple periods and apply different costs for each based on gold’s price levels.
  • Separate Analysis:
    • Evaluate performance metrics for 2003–2010 and post-2010 separately. This will help you determine if the strategy is overly reliant on the earlier period’s trends.

Practical Steps:

  1. Segment Backtest Results:
    • Divide results into multiple time frames (e.g., 2003–2010, 2011–2020, and 2021–present) and analyze performance metrics separately for each.
  2. Simulate Robust Costs:
    • Apply higher costs for lower price periods and re-run the backtest to evaluate its robustness across varying market conditions.
  3. Evaluate Strategy Adaptability:
    • Check how the strategy performs during flat or range-bound periods (e.g., 2012–2015) compared to strong trends (e.g., 2005–2010).
  4. Compare Across Assets:
    • Test the strategy on other metals like silver or correlated assets. This helps assess whether the strategy is robust to different price and volatility structures.

Conclusion:

You should absolutely scrutinize the 2003–2010 period. Adjusting costs based on relative price levels and segmenting your backtest will provide better insight into your strategy’s robustness. Additionally, focusing on OOS performance in post-2010 regimes is critical to avoid overfitting to historical bull markets.

Getimg Ai Img 8datamiprcgz5yojcaw7y

Elemental Confluence EA

()
HomePage 2

Here’s a detailed analysis and review of your Elemental Confluence EA performance for XAUUSD on the H1 timeframe based on the provided backtesting results.

Profitability

  1. Total Net Profit:
    • Achieving a net profit of $127,831.14 from an initial deposit of $5,000 is strong but modest compared to the Cycle of Life EA.
    • The Profit Factor of 1.82 (gross profit of $284,458.10 vs. gross loss of $156,626.96) indicates slightly better efficiency than the Cycle of Life EA.
  2. Expected Payoff:
    • The expected payoff of $24.43 per trade reflects moderate profitability per trade, suggesting the system relies on frequent trades rather than outsized gains.
  3. Winning and Losing Trades:
    • Winning trades make up 60.88% of the total, which is a favorable win rate for a trading strategy.
    • Average profit trade ($89.28) is slightly larger than the average loss trade (-$76.52), contributing to consistent profitability.
  4. Largest Trades:
    • The largest profit trade ($3,054.32) is over 2.33x the size of the largest loss trade (-$1,310.46), which reflects a favorable risk-reward profile.

Risk and Drawdown

  1. Absolute and Maximal Drawdown:
    • Absolute drawdown: $950.98 — indicates effective capital preservation relative to the starting deposit.
    • Maximal drawdown: $4,421.27 (5.19%) and Relative drawdown of 29.05% highlight controlled risk compared to the Cycle of Life EA.
  2. Risk per Trade:
    • Consecutive losses reached a maximum of 15 trades, but the financial impact was contained (-$882.46).
    • The largest consecutive loss period of -$2,008.29 (over 10 trades) suggests manageable risk even during poor performance phases.

Efficiency

  1. Trade Frequency:
    • Executed 5,233 trades over the backtest period, averaging about 1.5 trades per day, appropriate for a strategy on the H1 timeframe.
    • The system’s high win rate with frequent trades suggests it prioritizes capturing smaller, consistent gains.
  2. Consistency:
    • The system’s largest consecutive wins were 21 trades (profit $2,595.91), indicating streak potential.
    • The average number of consecutive wins (3) and losses (2) reflects short oscillations, favoring quicker recoveries from drawdowns.

Key Observations

  1. Profitability vs. Safety:
    • The Elemental Confluence EA generates consistent and steady profit, albeit at a smaller scale than Cycle of Life EA, but with significantly reduced risk.
  2. Win Rate and Payoff Balance:
    • A 60.88% win rate coupled with a reasonable average profit per trade ensures consistent performance.
    • While the profits per trade are modest, the system compensates with high trade frequency.
  3. Drawdown Control:
    • The maximum drawdown of 5.19% is within acceptable limits for most traders, showcasing the system’s robustness in adverse conditions.
  4. Scalability:
    • The system appears scalable, as drawdowns are well-managed and losses are capped effectively.

Recommendations for Optimization

  1. Increase Profitability Per Trade:
    • Explore adjustments to take-profit levels to capitalize on larger moves, especially for profitable trades, without sacrificing the win rate significantly.
  2. Enhance Loss Control:
    • While losses are generally well-managed, analyzing losing trades might help refine entry/exit points to further reduce average loss trade size.
  3. Test with Different Market Conditions:
    • Perform forward testing and Monte Carlo simulations to ensure the EA is robust across varying market conditions, spreads, and slippage scenarios.
  4. Leverage Dynamic Position Sizing:
    • Adjust trade sizes dynamically based on equity to potentially increase profits while maintaining low drawdown.

Final Verdict

The Elemental Confluence EA is a solid, low-risk strategy with consistent performance and high win rates. While its profitability is modest compared to the Cycle of Life EA, its drawdown and risk metrics are significantly better, making it a safer choice for steady returns. With minor tweaks to optimize profit per trade, this EA could become an excellent tool for traders prioritizing capital preservation and steady growth.