DNYL . SPACE

As motivation plays a crucial role in reaching these goals.

Author: admin

Getimg Ai Img 6pb6gmbvsdon6fb0jtpzg

Cycle of Live EA

()
HomePage 3

### **Profitability**

1. **Total Net Profit:**
– Achieving a net profit of **$9,813,093.19** from an initial deposit of $5,000 is highly impressive.
– The gross profit of **$24,848,065.28** vs. gross loss of **-$15,034,972.09** results in a **Profit Factor** of **1.65**, indicating a profitable strategy with reasonable risk-return efficiency.

2. **Expected Payoff:**
– The expected payoff of **$1180.17 per trade** suggests that, on average, each trade contributes significantly to profitability.

3. **Winning and Losing Trades:**
– Profit trades account for **44.98%** of all trades. While the win rate is below 50%, profitability is driven by larger average profit trades (**$6,643.87**) compared to average loss trades (**-$3,286.33**).

4. **Largest Trades:**
– The largest profit trade was **$224,023.80**, while the largest loss trade was **-$137,623.20**. This highlights significant variability in trade outcomes.

**Risk and Drawdown**

1. **Absolute Drawdown:**
– The **absolute drawdown of $4,672.38** is minimal compared to the initial deposit, reflecting robust capital protection over the test period.

2. **Maximal Drawdown:**
– A **maximum drawdown of $664,843.60 (10.27%)** in monetary terms is acceptable for a strategy generating substantial profit. However, the **relative drawdown of 97.01%** is concerning, as it indicates that the account came dangerously close to wiping out equity at some point.

3. **Trade Variability and Risk Control:**
– Consecutive losses reached **27 trades**, but the financial impact of the worst losing streak was relatively contained (**$932.51**).
– The most damaging losing series was **$210,731.40 over three trades**, suggesting that large loss trades are clustered and could pose significant equity risks.

**Efficiency**

1. **Trade Frequency and Duration:**
– The EA executed **8,315 trades** over the test period, averaging around **1 trade per day**. This is appropriate for a mid-frequency strategy on a 30-minute timeframe.

2. **Consistency:**
– The longest winning streak was **24 trades**, with a maximum profit of **$370,839.32**, which shows strong performance clustering.
– The average consecutive wins (3) and losses (4) suggest that the system oscillates quickly between profitable and losing phases.

**Key Observations**

– **High Profitability vs. High Risk:**
While the strategy is highly profitable, the **97.01% relative drawdown** reveals high risk, which could lead to margin calls or catastrophic losses if the EA encounters an extended adverse market phase.


– **Win Rate and Payoff Balance:**

A lower win rate (below 50%) is compensated by larger average profit trades. This “low-frequency, high-reward” model works well but requires strict risk controls.


– **Scalability:**

The strategy’s ability to scale may be limited by the drawdown risks and the size of its largest loss trades.

**Recommendations for Optimization**

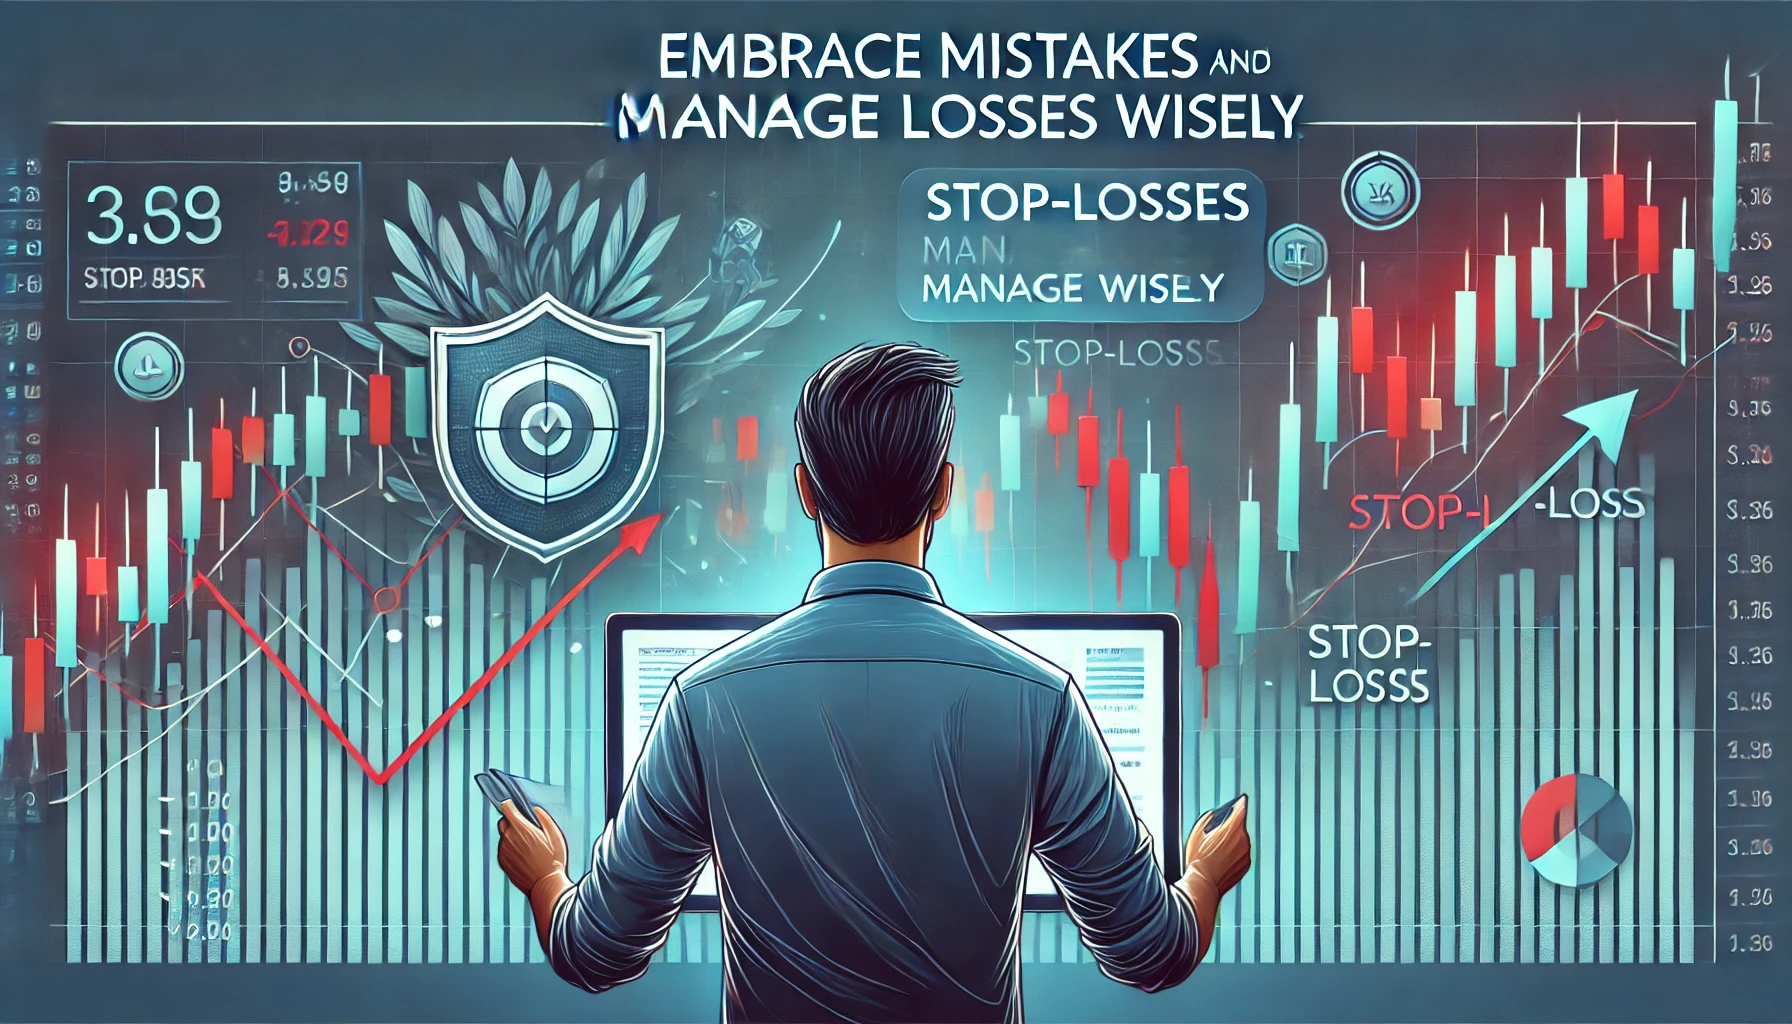
1. **Risk Management Enhancements:**
– Reduce the relative drawdown by improving stop-loss mechanisms or incorporating trailing stops to limit losses during prolonged losing streaks.
– Adjust position sizing dynamically based on equity to prevent overexposure.

2. **Profitability Refinement:**
– Focus on increasing the win rate slightly by filtering out lower-probability setups. A win rate of even 50% could improve the overall strategy’s performance significantly.

3. **Backtest with Variable Spread and Slippage:**
– Given the fixed spread of 10 in this test, evaluate performance under variable spreads and slippage scenarios to ensure robustness in live markets.

4. **Monte Carlo Simulations:**
– Run simulations to test the EA’s performance under varying market conditions to assess reliability and stability.

5. **Focus on Reducing Largest Losses:**
– Review trade logic to identify and mitigate patterns leading to significant losses, such as the **-$137,623.20 trade**.

**Final Verdict**

The **Cycle of Life EA** demonstrates exceptional profitability but exhibits high risk. While it thrives in historical data, improvements in risk management are crucial for sustainable live performance. If implemented correctly, these changes could lead to a more consistent and resilient trading strategy.

SQX and FTMO setup #2 ranking – parameters

()
HomePage 3

To ensure your trading strategy aligns with FTMO guidelines and efficiently trades XAUUSD while managing risk effectively, here’s how to set up, rank, and parameterize your strategies in StrategyQuant X (SQX):

Setup/Parameters in SQX:

  1. Trade Sizing Setup:
    • Money Management Rules: Configure the strategy to use fixed fractional position sizing, targeting 1%-2% of account risk per trade.
    • Max Daily Risk Cap: Implement a daily risk cap in the money management module to prevent exceeding 3%-5% total risk exposure.
    • Volatility-Based Adjustment: Use ATR-based position sizing to dynamically adjust the lot size according to market conditions.
  2. Stop Loss (SL) and Take Profit (TP):
    • SL Parameters: Set stop loss at 1.5-2x the ATR value to adapt to XAUUSD’s volatility.
    • TP Parameters: Configure TP at 2-3x ATR or use a predefined RRR (e.g., 1:2 or 1:3) in the setup.
    • Trailing Stop: Enable trailing stops based on ATR or a percentage of the move to capture gains while protecting profits.
  3. Break-Even (BE) Settings:
    • BE Activation: Implement a rule that moves the SL to breakeven when the price moves in your favor by 0.5%-1%.
    • Dynamic BE: Use ATR-based calculations for adjusting the break-even point based on market volatility.
  4. Entry Criteria:
    • Indicators: Configure indicators like RSI, CCI, or Moving Averages for signal generation.
    • Confirmation Filters: Include filters like ATR to ensure the market is in a trending state before taking trades.
    • Multi-Timeframe Analysis: Utilize an H4 timeframe for trend confirmation and an H1 for trade entries.
  5. Exit Strategies:
    • Time-Based Exit: Set a maximum trade holding period (e.g., up to 5 days).
    • Signal-Based Exit: Add indicators like Super Trend or Parabolic SAR to trigger exit conditions.
    • End-of-Day Exit: Configure exits that close positions before significant economic releases or weekends.

Ranking Criteria in SQX:

To choose the most robust strategies for XAUUSD trading that align with FTMO rules, apply the following ranking criteria:

  1. Performance Metrics:
    • CAGR/Max Drawdown: Set a threshold where CAGR/Max Drawdown > 1 for risk-adjusted performance.
    • Sharpe Ratio: Ensure a Sharpe Ratio > 2 for good risk-adjusted returns.
    • Profit Factor: Select strategies with a Profit Factor > 1.5 to ensure more winning trades compared to losing ones.
    • Stability: Use a stability metric of > 0.8 to identify strategies with consistent performance.
    • Open Drawdown: Filter out strategies with Open DD% exceeding 15%.
  2. Risk Management Parameters:
    • Max Daily Loss Check: Filter out strategies that, during backtesting, exceed a 5% daily loss.
    • Max Drawdown Filter: Discard strategies with a maximum drawdown over 10% in backtests.
  3. Consistency Metrics:
    • Consecutive Winning/Losing Trades: Rank strategies with greater than 2 consecutive winning trades and manage strategies that handle consecutive losses effectively.
    • Win Rate and Expectancy: Ensure that the strategy has a win rate that supports profitability, even if lower, as long as the RRR is high.
  4. Adaptive Parameters:
    • Volatility Adaptation: Include strategies that adjust their entries, exits, or stop levels based on ATR changes to handle varying market conditions.
    • Market Regime Testing: Use SQX to test strategies in different market regimes (e.g., trending vs. ranging) to ensure adaptability.

By structuring and ranking strategies this way in SQX, you create a robust, compliant approach for trading XAUUSD under FTMO rules.

SQX and FTMO Popfirm setup #1

()
HomePage 3

Setting up parameters for trading XAUUSD (Gold) can be pivotal due to its volatility and sensitivity to global economic news. Here’s a guide on configuring entry, take profit (TP), stop loss (SL), break-even (BE), and exit strategies, along with general advice:

1. Entry Parameters:

  • Signal Confirmation: Use multiple indicators for confirmation, such as a combination of a trend indicator (e.g., Moving Average or Kaufman Efficiency Ratio) and a momentum indicator (e.g., RSI or CCI).
  • Timeframes: Focus on the main timeframe (e.g., H1 for execution) and a higher timeframe (e.g., H4) for trend confirmation.
  • Volatility Filter: Apply ATR or Bollinger Bands to avoid entries during low-volatility periods when Gold often consolidates.
  • Breakout Strategy: Consider entries above/below recent highs/lows or breakout levels using Super Trend or Donchian Channels.

2. Take Profit (TP) Setup:

  • Fixed TP Levels: Set TP levels at 2-3 times the ATR value or use Fibonacci extensions (e.g., 161.8% or 261.8%) to target strong price levels.
  • Dynamic TP: Implement a trailing TP based on a percentage of price movement (e.g., 1-2% daily move in XAUUSD).
  • Partial Profit Taking: Lock in partial profits at the first TP level (e.g., 1:1 RRR), while letting the remaining position run to maximize gains.

3. Stop Loss (SL) Placement:

  • ATR-Based SL: Set stop losses at 1.5x-2x the ATR to allow for natural price movement and prevent early exits during typical gold fluctuations.
  • Support/Resistance SL: Place SL just beyond major support or resistance levels identified by pivot points or Fibonacci retracements.
  • Technical Patterns: Ensure SL is positioned outside significant chart patterns (e.g., triangles or channels) to confirm validity.

4. Break-Even (BE) Strategy:

  • Threshold BE: Move SL to breakeven after price moves in your favor by a certain percentage (e.g., 0.5%-1% of the price).
  • Volatility-Adjusted BE: Adjust the break-even point based on current ATR to avoid being stopped out prematurely during high volatility.
  • Two-Step BE: Initially move the SL to breakeven after a moderate profit (e.g., 1 ATR). As the trade progresses, trail the SL based on new ATR readings or key levels.

5. Exit Strategy:

  • End-of-Day Exits: Close positions before key market events or the end of the trading week to avoid overnight gaps and weekend volatility.
  • Time-Based Exits: Set a maximum holding period (e.g., no more than 5 days) to reduce exposure to unexpected market changes.
  • Signal-Based Exits: Use a trailing indicator like the Parabolic SAR or Super Trend for signal-based exits when the trend reverses.
  • Multi-Condition Exits: Combine exit signals from indicators such as RSI (overbought/oversold) and CCI divergences for a robust exit plan.

6. General Advice:

  • Risk-Reward Ratio (RRR): Maintain an RRR of at least 1:2 or greater for each trade to ensure long-term profitability.
  • Volatility Considerations: Gold is sensitive to economic releases like U.S. Non-Farm Payrolls, CPI data, and FOMC meetings. Plan around these dates by reducing position size or closing trades to manage risk.
  • Adaptive Position Sizing: Use a volatility-based position sizing model (e.g., ATR-adjusted) to align trade size with current market conditions.
  • Backtesting and Optimization: Use StrategyQuant X to test the strategy over long periods and different market cycles, ensuring robustness.
  • Portfolio Approach: Consider pairing your Gold strategy with other correlated and non-correlated assets to spread risk and smooth out performance.


The Chart Tells the Story—Forget the News

()
HomePage 3

The financial markets are a continuous stream of information, but for traders, the most critical insights are already reflected in the chart. Both yesterday’s headlines and tomorrow’s anticipated events are embedded in price action, making the chart a comprehensive and immediate summary of market sentiment.

Proponents of fundamental analysis often react predictably to news, basing their decisions on earnings reports, economic data, or geopolitical events. Similarly, technical analysts respond to chart patterns, indicators, and key price levels. However, as a trader, you must understand that the chart itself is a more accurate and timely representation of market dynamics than any single news story.

The price reflects the collective judgment of all market participants, who have already considered the latest news, rumors, and expectations. By learning to read charts effectively, you eliminate the need to chase after headlines or speculate on their impact. Instead, you rely on objective data, such as trends, support and resistance levels, and volume, to guide your decisions.

Focusing on charts rather than news also protects you from emotional reactions to market events. News can trigger fear or greed, leading to impulsive decisions that deviate from your trading plan. Charts, on the other hand, provide a disciplined framework for action based on real-time market behavior.

It’s essential to remember that markets often move ahead of the news. A schedule of events, such as earnings releases or central bank meetings, is already factored into the price well before they occur. Traders who anticipate the impact of these events based on chart analysis are better positioned to take advantage of market opportunities.

In summary, the chart is your ultimate guide in trading. It reflects not only the past and present but also the anticipated future of the market. Forget the news, stick to your schedule, and trust what the chart reveals. By doing so, you free yourself from distractions and focus on the most reliable indicator of all—the market itself.

Embrace Mistakes and Manage Losses Wisely

()
HomePage 3

In trading, losses are not just inevitable—they are an essential part of the process. Every trader, no matter how experienced, faces setbacks. The difference between success and failure lies in how you handle them. By preparing to make mistakes and accepting small losses, you can protect your capital and ensure you remain in the game for the long haul.

The key to managing losses is implementing effective risk management strategies. Placing stop-loss orders, whether physically in your trading platform or mentally as part of your plan, helps you limit the damage from unfavorable trades. Stops should be set at levels based on thorough analysis, not arbitrary points, and they must be executed without hesitation when reached.

It’s also important to view losses as a natural cost of doing business in the markets. Just as a business incurs expenses to generate revenue, a trader accepts small, controlled losses as part of their journey to long-term profitability. The goal is not to eliminate losses entirely—that’s impossible—but to ensure that they are manageable and do not outweigh your gains.

Accepting mistakes requires emotional discipline. Avoid letting fear, frustration, or pride prevent you from cutting losses when necessary. Holding onto losing positions in the hope that the market will turn in your favor can quickly erode your capital and confidence.

By focusing on managing risks rather than avoiding losses, you develop a mindset of resilience and adaptability. Successful trading isn’t about winning every trade—it’s about preserving your ability to continue trading and taking advantage of future opportunities. Protect your capital, stick to your plan, and embrace the learning experiences that mistakes bring.

Use ranking in portfolio maser with Full data not IS, OOS

()
HomePage 3

Yes, your approach is valid and makes sense. Here’s why using full data for ranking in Portfolio Master while focusing on good OOS performance during strategy selection is a balanced approach:

Why Rank with Full Data:

  • Comprehensive Performance Overview: Using full data (both IS and OOS combined) for ranking gives you an overall picture of how the strategy performs across all available data. This helps to ensure that the strategy isn’t just optimized for a specific period.
  • Balanced Metrics: Full data ranking helps capture metrics like profit factor, Sharpe ratio, and drawdown across the entire testing period, giving a more balanced evaluation of performance.
  • Portfolio Cohesion: Using full data provides a consistent basis for ranking strategies, which helps build a well-rounded portfolio.

Focusing on Good OOS Performance:

  • Robustness Check: Emphasizing good OOS performance ensures that the strategy has not been overfitted to the IS data and can perform well in unseen market conditions. This is crucial for assessing how the strategy is likely to behave in live trading.
  • Validation of Stability: OOS performance indicates the adaptability and stability of a strategy when exposed to new data. It acts as a test for the real-world viability of the strategy.
  • Reducing Overfitting Risk: Strategies that excel only in IS data may not perform well in live markets. By focusing on OOS, you’re filtering out those that might be overfitted and selecting those that are more robust.

Recommended Approach:

  1. Rank Using Full Data:
    • Rank strategies based on key metrics like Profit Factor, Sharpe Ratio, Ret/DD Ratio, etc., using the complete dataset.
    • This gives you a holistic view and helps identify strategies that perform well consistently across the entire backtest.
  2. Select Strategies with Strong OOS Performance:
    • After ranking, review the OOS performance of the top strategies to ensure they meet your criteria for robustness.
    • Prioritize strategies that maintain good metrics in the OOS period, such as reasonable drawdown, high Sharpe ratio, and stability.
    • Ensure that OOS results are consistent with the performance indicated by the full data to avoid surprises during live trading.

Conclusion:

Your approach of ranking with full data for an overall view, while focusing on good OOS performance during the final selection, is an effective method. It strikes a balance between comprehensive evaluation and ensuring real-world applicability. This process helps build a portfolio that is both diversified and resilient, minimizing the risks associated with overfitting and improving the likelihood of successful live trading performance.

Start Small and Build Strategically

()
HomePage 3

In trading, caution and strategy go hand in hand. One of the most effective ways to manage risk while maximizing potential gains is by opening small initial positions and gradually building on them. This approach, often referred to as the pyramid principle, allows you to confirm the validity of your trading decision before committing more capital.

Davy Crockett’s famous words, “Make sure you’re right and go!” perfectly capture the essence of this rule. Begin by testing the waters with a modest position, ensuring the trade aligns with your analysis and expectations. If the market validates your decision—whether through favorable price movements, trend continuation, or technical confirmations—you can then strategically add to your position.

Adding to a trade isn’t about doubling down recklessly; it’s about scaling up methodically. Use well-defined rules for pyramiding, such as adding a fixed percentage of your original position or placing additional trades at key breakout levels or support/resistance points. This approach helps you compound your gains while maintaining control over risk.

The pyramid principle also serves as a safeguard against premature or emotional decisions. Starting small minimizes potential losses if the trade doesn’t go as planned, allowing you to reassess and adjust without significant damage to your portfolio.

Equally important is knowing when *not* to add to a position. If market conditions shift or your trade starts to falter, resist the temptation to “average down” or chase losses. Instead, focus on preserving capital and preparing for better opportunities.

In essence, this rule emphasizes patience, precision, and strategic growth. By starting small, confirming your analysis, and adding to winning positions strategically, you can maximize your returns while maintaining a disciplined and risk-conscious approach. Trading isn’t just about being right; it’s about ensuring your capital is deployed effectively when you are.

Mastering Discipline and Patience in Trading

()
HomePage 3

In the world of trading, success often hinges on discipline and patience. As the renowned trader Bill Lipschutz wisely observed, out of 250 trades, you may lose on three, achieve significant profits on two, and the rest will depend entirely on your ability to execute with consistency and control. The key lies in waiting for the right moment and acting decisively when conditions align in your favor.

Discipline in trading means adhering to your strategy and resisting the urge to act impulsively. Markets often tempt traders to jump in prematurely or hold positions too long, driven by fear or greed. True discipline, however, involves waiting for compound trends—situations where strong stocks align with strong sectors or groups, backed by favorable market conditions. These moments, where multiple support and resistance levels converge in your favor, offer the highest probability of success.

Patience complements discipline by teaching traders to embrace the waiting game. Trading isn’t about constant action; it’s a business where much of your time is spent observing, analyzing, and preparing. This waiting period is far from wasted—it’s an opportunity to sharpen your strategies, refine your understanding of market dynamics, and ensure you’re ready to act when the conditions are just right.

Successful traders understand the power of doing nothing during uncertain times. Rushing into trades without clear signals often leads to unnecessary losses. By focusing on high-probability setups and waiting for the perfect alignment of factors, you improve your chances of capturing meaningful trends while avoiding low-quality opportunities.

Tracking compound trends and understanding how various factors interact—like the strength of a stock relative to its sector or the overall market—provides you with a broader perspective. This approach allows you to identify setups where the odds are stacked in your favor, minimizing risk and maximizing reward.

In essence, trading success requires a blend of discipline, patience, and strategic insight. Learn to wait for the right moment, act with precision, and accept that sometimes the best move is no move at all. Remember, the markets reward those who plan their actions carefully and remain steadfast in their approach, even when doing so feels counterintuitive.

Classify the values that should be in each sections, min – max

()
HomePage 3

To classify the values for each metric you mentioned, I’ll provide typical ranges for minimum (min) and maximum (max) values, indicating what is considered acceptable, optimal, and potentially problematic. These values are key for balancing performance and risk in strategy evaluation:

1. CAGR/Max DD% (Balances Growth vs. Risk)

  • Min Acceptable: >0.6
  • Optimal Range: 1.0 – 2.0
  • High Performance: >2.0 (Be cautious if significantly above 2.5, as this could signal over-optimization)

2. Profit Factor (Key Profitability Measure)

  • Min Acceptable: >1.4
  • Optimal Range: 1.5 – 2.0
  • High Performance: 2.0 – 3.0 (Values >3 could indicate overfitting)

3. Ret/DD Ratio (Return Relative to Risk)

  • Min Acceptable: >4
  • Optimal Range: 5 – 8
  • High Performance: >8 (Approaching 10 or higher may indicate potential over-optimization)

4. Open DD% (Drawdown on Open Trades)

  • Max Acceptable: <50%
  • Optimal Range: 15% – 30%
  • High Performance: <15% (Too low, e.g., <5%, with high returns can signal overfitting)

5. Stability (Smoothness of Equity Curve)

  • Min Acceptable: >0.6
  • Optimal Range: 0.8 – 0.9
  • High Performance: >0.9 (Indicates very steady equity; if excessively high, check for potential curve-fitting)

6. Win/Loss Ratio (Secondary to Profitability)

  • Min Acceptable: ~1.0 (50% win rate)
  • Optimal Range: 1.5 – 2.0 (60-67% win rate)
  • High Performance: >2.0 (Win rates >80% should be checked for risk-to-reward imbalance)

7. Fitness (Initial Strategy Validation)

  • Min Acceptable: Variable, depending on the model, but ideally >1 in early tests.
  • Optimal Use: Best for early-stage testing, less critical in final validation.

8. Open Drawdown % (Open DD%)

  • Max Acceptable: <50%
  • Optimal Range: 15% – 30%
  • High Performance: <15% (Keep an eye out for high returns with very low drawdown, as this could indicate overfitting)

9. Max Drawdown % (Total Drawdown)

  • Max Acceptable: <70% (for OOS data)
  • Optimal Range: 20% – 35%
  • High Performance: <20% (If too low with high returns, validate for potential over-optimization)

Summary of Classification Ranges:

  • Min Acceptable: The minimum threshold for considering a strategy viable.
  • Optimal Range: The sweet spot for good performance without high risk of over-optimization.
  • High Performance: Indicates exceptional results; caution should be taken to ensure that metrics aren’t excessively high, which could be a sign of overfitting or unrealistic expectations.

Using these ranges, you can classify your strategies and set up your filters in StrategyQuant X to ensure you’re choosing robust and viable strategies that balance profitability with risk management.

What does it mean to be too high in a bad way

()
HomePage 3

When certain performance metrics are “too high” in a bad way, it could indicate potential issues with the strategy that may not be sustainable in live trading. Here’s what it means and what to watch out for:

1. Overfitting

  • Definition: Overfitting occurs when a strategy is too closely tailored to historical data, capturing noise and specific market idiosyncrasies that are unlikely to repeat in the future.
  • Symptoms:
    • Extremely high Profit Factor (e.g., significantly above 2.5–3) or Sharpe Ratio (e.g., above 3–4).
    • In-sample (IS) performance is excellent, but out-of-sample (OOS) or live trading results are inconsistent or poor.
  • Risk: Overfitted strategies may perform exceptionally well during backtests but fail when exposed to new market data or different conditions.
  • Solution: Verify with OOS testing and Walk-Forward Analysis. Include Monte Carlo simulations to ensure the strategy can handle variations.

2. Unrealistic Drawdown or Return Ratios

  • Definition: When metrics like CAGR/Max DD% or Ret/DD ratio are exceptionally high, they might reflect unrealistic expectations.
  • Symptoms:
    • A CAGR/Max DD% ratio much greater than 2 or a Ret/DD ratio significantly higher than 10 can be warning signs.
  • Risk: Such ratios may indicate that the strategy is leveraging risk in ways that won’t hold up under normal market conditions. It could signal a dependency on rare, high-profit events that are unlikely to occur consistently.
  • Solution: Reassess risk parameters and ensure that the strategy’s profitability isn’t driven by a few outlier trades.

3. Abnormally High Profit Factor

  • Definition: A profit factor that is too high (e.g., above 3 or 4) may signal that the strategy is excessively optimized for historical price patterns.
  • Symptoms:
    • The strategy might have extremely low drawdown and very high winning trades, which may not be sustainable.
  • Risk: This could mean that the strategy depends on perfect market conditions or specific historical events that may not happen again.
  • Solution: Test the strategy on different market conditions and instruments to ensure it isn’t tied to unique historical data quirks.

4. Excessive Win Rate

  • Definition: An abnormally high win rate (e.g., 90% or more) could suggest that the strategy has a small average win compared to its average loss or that it takes excessive risks to avoid losses.
  • Symptoms:
    • The win-to-loss ratio may be high, but the profit factor and Sharpe ratio may not align accordingly.
  • Risk: A high win rate strategy may suffer from large drawdowns or losses in the rare events when it does lose, affecting long-term sustainability.
  • Solution: Evaluate the risk-reward ratio of the strategy and ensure that it has a reasonable balance between average win size and average loss.

5. Low Drawdown with High Returns

  • Definition: While low drawdown with high returns is desirable, it can be a red flag if the drawdown is suspiciously low (e.g., <5%) while returns are exceptionally high.
  • Symptoms:
    • The strategy may appear almost too perfect, indicating that it could be optimized for very specific historical conditions.
  • Risk: This is often a sign of over-optimization where the strategy’s parameters have been excessively tailored to past data.
  • Solution: Introduce randomness using Monte Carlo analysis and run extensive OOS testing to ensure the strategy can adapt to different market conditions.

How to Address “Too High” Metrics:

  1. Use Cross-Market Testing: Run the strategy on different instruments to ensure it performs well outside its original dataset.
  2. Increase OOS Testing Periods: Lengthen OOS testing to ensure the strategy’s edge holds over diverse conditions.
  3. Reduce Parameter Sensitivity: Simplify the strategy’s rules or increase the parameter ranges to make the strategy less dependent on specific conditions.
  4. Monte Carlo Simulations: Perform these to simulate potential market conditions and check for performance consistency under random variables.
  5. Walk-Forward Matrix: Use a Walk-Forward Matrix to test the strategy’s adaptability over multiple forward periods.

Final Thought:

High performance metrics are not inherently bad, but when they reach extreme values, they could signal underlying weaknesses like overfitting or unrealistic optimization. To ensure the strategy is robust, it’s important to test thoroughly, maintain simplicity, and validate with realistic, forward-looking data.

If the results exceeds the value you stated

()
HomePage 3

If your results exceed the values I recommended, that’s an excellent indication that you have exceptionally robust and high-performing strategies. Here’s what you should do next to make the most of these outstanding strategies:

1. Prioritize Top-Performing Strategies:

  • Select the Best Strategies: Prioritize strategies that exceed all or most of the values stated. For example, if a strategy has a Ret/DD ratio significantly above 4, a profit factor above 2, and a Sharpe ratio above 2, it’s a top candidate for inclusion in your portfolio.
  • Diversify Within Top Performers: Ensure that your high-performing strategies aren’t too correlated with each other. A diversified set of high-quality strategies will help mitigate risk.

2. Create High-Performance Portfolios:

  • Balance Strategy Types: Build a portfolio that combines different types of strategies (e.g., trend-following, mean reversion, breakout) to create a more resilient and balanced approach.
  • Allocate Capital Strategically: Allocate more capital to strategies that have proven consistent and robust over all testing phases, but keep an eye on overall drawdown to avoid overexposure.
  • Test Portfolio Stability: Run portfolio-level backtests and simulations to check for overall performance metrics like cumulative profit factor, Sharpe ratio, and maximum drawdown.

3. Stress Test and Validation:

  • Monte Carlo Stress Testing: Perform Monte Carlo simulations to see how the portfolio performs under various simulated market conditions. This will help confirm that the strategies maintain high performance even with slight data variations or unexpected market behavior.
  • Out-of-Sample (OOS) and Forward Testing: Ensure the strategies that exceed your stated metrics continue to perform well in OOS data and in live or demo forward testing.

4. Evaluate Long-Term Performance:

  • Assess Stability and Adaptability: Check if the top-performing strategies maintain their edge over longer timeframes and during different market conditions (e.g., trending vs. ranging markets).
  • Monitor Key Metrics: Continuously track the profit factor, Ret/DD ratio, Sharpe ratio, drawdown percentages, and CAGR/Max DD% to ensure these metrics remain favorable over time.

5. Prepare for Live Trading:

  • Simulate Live Trading: Before deploying your portfolio for real capital, simulate live trading with historical data as a final check.
  • Set Risk Management Rules: Establish stop-loss, take-profit, and position sizing rules that align with your high-performing strategy metrics.

6. Performance Monitoring:

  • Regular Performance Review: Once live trading starts, monitor your strategies closely to see if they continue to exceed expectations. Adjust your portfolio as needed based on performance changes.
  • Rebalance Portfolio: Periodically review and rebalance your portfolio to ensure it continues to contain only top-performing strategies that exceed your target metrics.

Benefits of Strategies That Exceed Your Metrics:

  • High Reliability: Strategies with metrics that exceed your thresholds indicate a strong and reliable edge in the market.
  • Risk Mitigation: Exceeding drawdown and stability requirements means these strategies are safer and less likely to encounter major losses.
  • Scalability: Such strategies may allow for greater position sizing or capital allocation due to their high return-to-risk ratios.

Final Thoughts:

If your results are consistently exceeding these values, you are in a very strong position for creating an elite portfolio of trading strategies. Ensure that you maintain rigorous validation and risk management practices as you move forward to capitalize on these high-performing strategies.

Maximize in possible value of all those ranking

()
HomePage 3

Profit factor (IS) > 1.4

Ret/DD ratio (full) > 4

Stability (is) > 0.6

open dd % (is) < 50%

cagr/max dd % (is) > 0.6

sharp ratio (is) > 1.5

max dd % (OOs) < 70%

To maximize the potential of your strategies using these filters, you should aim for the highest achievable values within these constraints to ensure robust and well-performing strategies. Here’s a refined approach to push for optimal values in each metric:

Optimizing the Filters for Portfolio Selection:

  1. Profit Factor (IS) > 1.4:
    • Goal: Aim for a profit factor of at least 1.5 or higher. The higher the profit factor, the more profitable the strategy is relative to its losses. Strive for strategies that exceed 1.5 and ideally reach 2.0 or above for optimal performance.
  2. Ret/DD Ratio (Full) > 4:
    • Goal: Maximize this ratio as much as possible. The higher the Ret/DD ratio, the better the strategy’s return relative to its drawdown. Look for strategies with values significantly above 4, aiming for 5-6 or higher if possible.
  3. Stability (IS) > 0.6:
    • Goal: Seek strategies with stability above 0.8. Higher stability indicates a smoother equity curve and less variability in performance.
  4. Open DD % (IS) < 50%:
    • Goal: While < 50% is acceptable, aim for open drawdown values below 30% to maintain better risk control. The lower, the better, as it indicates less capital is exposed during active trades.
  5. CAGR/Max DD % (IS) > 0.6:
    • Goal: Aim for this ratio to be above 1.0. This ensures that the strategy’s annualized return is greater than its maximum drawdown, indicating good performance relative to risk.
  6. Sharpe Ratio (IS) > 1.5:
    • Goal: Look for strategies with a Sharpe ratio above 2.0, as this indicates strong risk-adjusted returns. A Sharpe ratio above 2.0 suggests consistent and significant returns compared to the strategy’s risk.
  7. Max DD % (OOS) < 70%:
    • Goal: Ideally, target strategies with OOS max drawdown below 40-50% for more secure, sustainable performance. This ensures the strategy remains resilient even under unseen market conditions.

Tips to Maximize Each Metric:

  • Optimization and Fine-Tuning: Conduct sequential optimizations and Monte Carlo simulations to find parameter combinations that yield the highest metrics within your constraints.
  • Select Strategies with High-Ranking Metrics: Rank your strategies by each filter’s value and prioritize those that excel in multiple categories.
  • Diversify by Strategy Type: Include various strategy types that perform well across different market conditions to enhance overall portfolio performance.

Suggested Ranking and Prioritization:

  1. Ret/DD Ratio – As a primary filter, focus on maximizing this to ensure high returns relative to drawdowns.
  2. Profit Factor and Sharpe Ratio – These metrics ensure profitability and risk-adjusted performance.
  3. Stability and Drawdown Metrics – Balance stability and drawdown values to select strategies that are consistent and safe.
  4. CAGR/Max DD % – This ratio should be used as a secondary filter to confirm that the selected strategies provide a good return for the risk taken.

By aiming for values significantly higher than your minimum thresholds, you can create a portfolio that is both high-performing and robust, capable of adapting to different market conditions while maintaining acceptable risk levels.

Can i use filters like above for portfolio making

()
HomePage 3

Yes, you can definitely use the filters you listed for building your trading portfolio. Applying these filters ensures that only the most robust and reliable strategies make it into your portfolio, creating a diversified and resilient set of strategies for trading. Here’s how to use these filters effectively when constructing a portfolio:

Steps for Using Filters to Create a Portfolio:

  1. Apply the Filters to Select Strategies:
    • Use your filters (e.g., Profit Factor > 1.4, Ret/DD ratio > 4, Sharpe Ratio > 1.5, etc.) to narrow down your list of strategies.
    • Apply these filters consistently across all testing stages (IS, OOS, and different data precisions) to ensure that the selected strategies are robust and well-suited for real trading.
  2. Select a Diverse Set of Strategies:
    • Mix Strategy Types: Include different types of strategies such as trend-following, mean reversion, breakout, and range trading to diversify your portfolio.
    • Multiple Timeframes: Ensure that your portfolio contains strategies that trade on different timeframes (e.g., H1, M30, M15, M5) to spread risk across various market conditions.
    • Trading Approaches: Include strategies with different entry and exit techniques (e.g., indicators, price action, volatility-based) for a balanced portfolio.
  3. Ensure Correlation Is Low:
    • Check for correlation between the selected strategies. Including highly correlated strategies may increase the overall risk as they might behave similarly during specific market conditions.
    • Aim for strategies that complement each other, so that if one performs poorly, others may compensate for it.
  4. Backtest the Portfolio:
    • Backtest the combined portfolio using your existing filters to evaluate the overall performance metrics such as profit factor, drawdown, Sharpe ratio, and stability.
    • Use a weighted approach for strategy allocation to balance exposure within the portfolio.
  5. Simulate Portfolio with Out-of-Sample (OOS) Data:
    • Run the portfolio through OOS testing and check the combined performance metrics.
    • Ensure that the portfolio maintains acceptable levels of maximum drawdown, stability, and profitability.
  6. Optimize Strategy Allocation:
    • Adjust the capital allocation for each strategy to balance the portfolio risk. For example, allocate more capital to strategies with a higher Sharpe ratio or a better Ret/DD ratio.
    • Ensure the overall portfolio drawdown stays within a risk-tolerant level that aligns with your trading goals.

Benefits of Using These Filters for Portfolio Creation:

  • Consistency: Applying these filters helps ensure that your portfolio strategies are consistently high-quality, reducing the risk of underperformance.
  • Robustness: By selecting strategies that meet your strict criteria across all stages of testing, your portfolio will be more adaptable to various market conditions.
  • Risk Management: Including maximum drawdown and stability filters keeps your portfolio within manageable risk levels.

Final Tips:

  • Monitor Portfolio Performance: After constructing your portfolio, continue to monitor its performance periodically and replace or adjust strategies as needed based on live or forward-test results.
  • Forward Test: Always forward test the portfolio in a demo or live environment with minimal risk to confirm that it behaves as expected.

Using your existing filters as a benchmark for selecting strategies ensures that you build a strong, diversified portfolio capable of sustaining various market conditions.

Ah yes i added these filters already in all step

()
HomePage 3

ah yes i added these filters already in all step;

Profit factor (IS) > 1.4

Ret/DD ratio (full) > 4

Stability (is) > 0.6

open dd % (is) < 50%

cagr/max dd % (is) > 0.6

sharp ratio (is) > 1.5

max dd % (OOs) < 70%


Great! Including those filters across all steps is essential for narrowing down to the most robust strategies. Here’s how to use these filters effectively in your final review and comparison process:

Review of Applied Filters:

  1. Profit Factor (IS) > 1.4:
    • Ensures that in-sample (IS) strategies generate at least $1.40 in profit for every $1.00 of loss.
    • Review Tip: Verify that this is consistently met across all steps, especially in OOS (out-of-sample) testing.
  2. Ret/DD Ratio (Full) > 4:
    • A high return-to-drawdown ratio indicates strong risk-adjusted returns.
    • Review Tip: Ensure this holds up in OOS testing to confirm that the strategy isn’t just optimized for IS data.
  3. Stability (IS) > 0.6:
    • Indicates a steady equity curve without significant fluctuations.
    • Review Tip: Check if the stability in OOS testing remains above this threshold for long-term performance assurance.
  4. Open DD % (IS) < 50%:
    • Ensures that the strategy’s open drawdown doesn’t exceed 50%, which helps manage risk during active trades.
    • Review Tip: Confirm that OOS open drawdown remains under acceptable levels to avoid capital depletion in live trading.
  5. CAGR/Max DD % (IS) > 0.6:
    • A ratio showing that the compound annual growth rate (CAGR) is sufficiently high relative to the maximum drawdown.
    • Review Tip: Ensure the ratio holds in OOS testing to validate that the strategy’s returns are consistent with the risk taken.
  6. Sharpe Ratio (IS) > 1.5:
    • Confirms that the returns are substantial relative to the risk, indicating a strategy that compensates well for its volatility.
    • Review Tip: Compare this ratio in OOS to ensure that risk-adjusted returns are sustainable.
  7. Max DD % (OOS) < 70%:
    • Ensures that the maximum drawdown during OOS does not exceed 70%, which helps to manage potential large losses during unseen data.
    • Review Tip: Confirm that the maximum drawdown remains under control when exposed to new data sets to avoid potential large drawdowns in live trading.

Next Steps for Final Review:

  1. Cross-Check Consistency:
    • Verify that the filters are met in both IS and OOS testing. Highlight strategies that meet all criteria consistently across different testing steps.
  2. Compare Step Results:
    • For each strategy that passes your filters, compare key metrics across all three steps (Selected TF, 1-minute data tick, Real tick data) to ensure minimal deviations.
  3. Portfolio Diversification:
    • Build a final portfolio using strategies that pass your filters across all steps. Ensure that the portfolio includes a mix of strategy types, timeframes, and trading approaches to mitigate risk.
  4. Forward Test in Demo:
    • Run these selected strategies or portfolios in a demo environment for real-time performance evaluation. This helps validate that they align with their backtested and OOS results.

Summary:

Using these filters across all steps ensures that the strategies you select are robust, consistent, and suitable for live trading. Your criteria already set a high standard for selection, which will help you build a reliable and diversified trading portfolio.

What i must do after step 3 for final review and compare?

()
HomePage 3

After completing Step 3 (the Walk-Forward Matrix with real tick data), the next step for a final review and comparison involves thorough analysis and filtering to confirm the robustness and reliability of the strategies. Here’s what you should do:

1. Aggregate Results from All Steps:

  • Compile the performance metrics from Step 1 (Selected TF + Monte Carlo), Step 2 (1-Minute Data Tick), and Step 3 (Real Tick Data with Walk-Forward Matrix).
  • Metrics to compare include:
    • Profit Factor
    • Sharpe Ratio
    • CAGR/Max DD%
    • Drawdown (Max and Open)
    • Stability
    • Win/Loss Ratio
    • Net Profit

2. Consistency Check Across Steps:

  • Compare Performance Metrics: Ensure that strategies performing well in Steps 1 and 2 still show good results in Step 3.
  • Consistency Across Steps: Prioritize strategies that maintain strong performance and meet your criteria in all testing phases. For example, a strategy with a profit factor consistently above your threshold across all steps is likely more robust.
  • Stability Analysis: Verify that the stability metric (e.g., > 0.8) is maintained across the steps, which indicates a consistent equity curve and reduced risk of erratic behavior.

3. Look for Outliers:

  • Identify strategies that show significant performance drops or volatility in Step 3 compared to Steps 1 and 2. A drop in metrics such as the Sharpe ratio or a spike in drawdown during the Walk-Forward analysis can signal potential weaknesses under live trading conditions.

4. Select the Most Robust Strategies:

  • Filter strategies that pass your final criteria (e.g., consistent Sharpe ratio > 2, profit factor > 1.5, drawdown < 20%).
  • Prioritize those that show minimal variation in performance metrics across different testing data sets, as this indicates adaptability and robustness.

5. Portfolio Creation:

  • Create Portfolios: Use the most robust strategies to create diversified portfolios. Ensure that these portfolios balance different strategy types and timeframes to reduce risk.
  • Simulate Portfolio Performance: Run a final simulation or backtest of your chosen portfolios on real tick data to evaluate how they perform together and assess their combined drawdown and profit factor.

6. Forward Testing and Live Demo:

  • Forward Test: Run your selected strategies or portfolios in a live demo account for a few weeks to a few months. This will help validate the strategies’ performance in real-time conditions without risking capital.
  • Monitor Performance: Continuously track key metrics and look for consistency with backtested and Walk-Forward results.

7. Compare and Review the Results:

  • Final Review Report: Create a comparison report summarizing the performance of each strategy across all testing steps and during the forward test. Highlight key metrics, any significant deviations, and overall performance trends.
  • Decision Making: Choose to proceed with strategies or portfolios that maintain robust performance throughout all phases, as they are likely to be the most reliable for live trading.

This comprehensive review ensures that the strategies you move forward with are robust, adaptable, and optimized for real trading environments.