Table of Contents
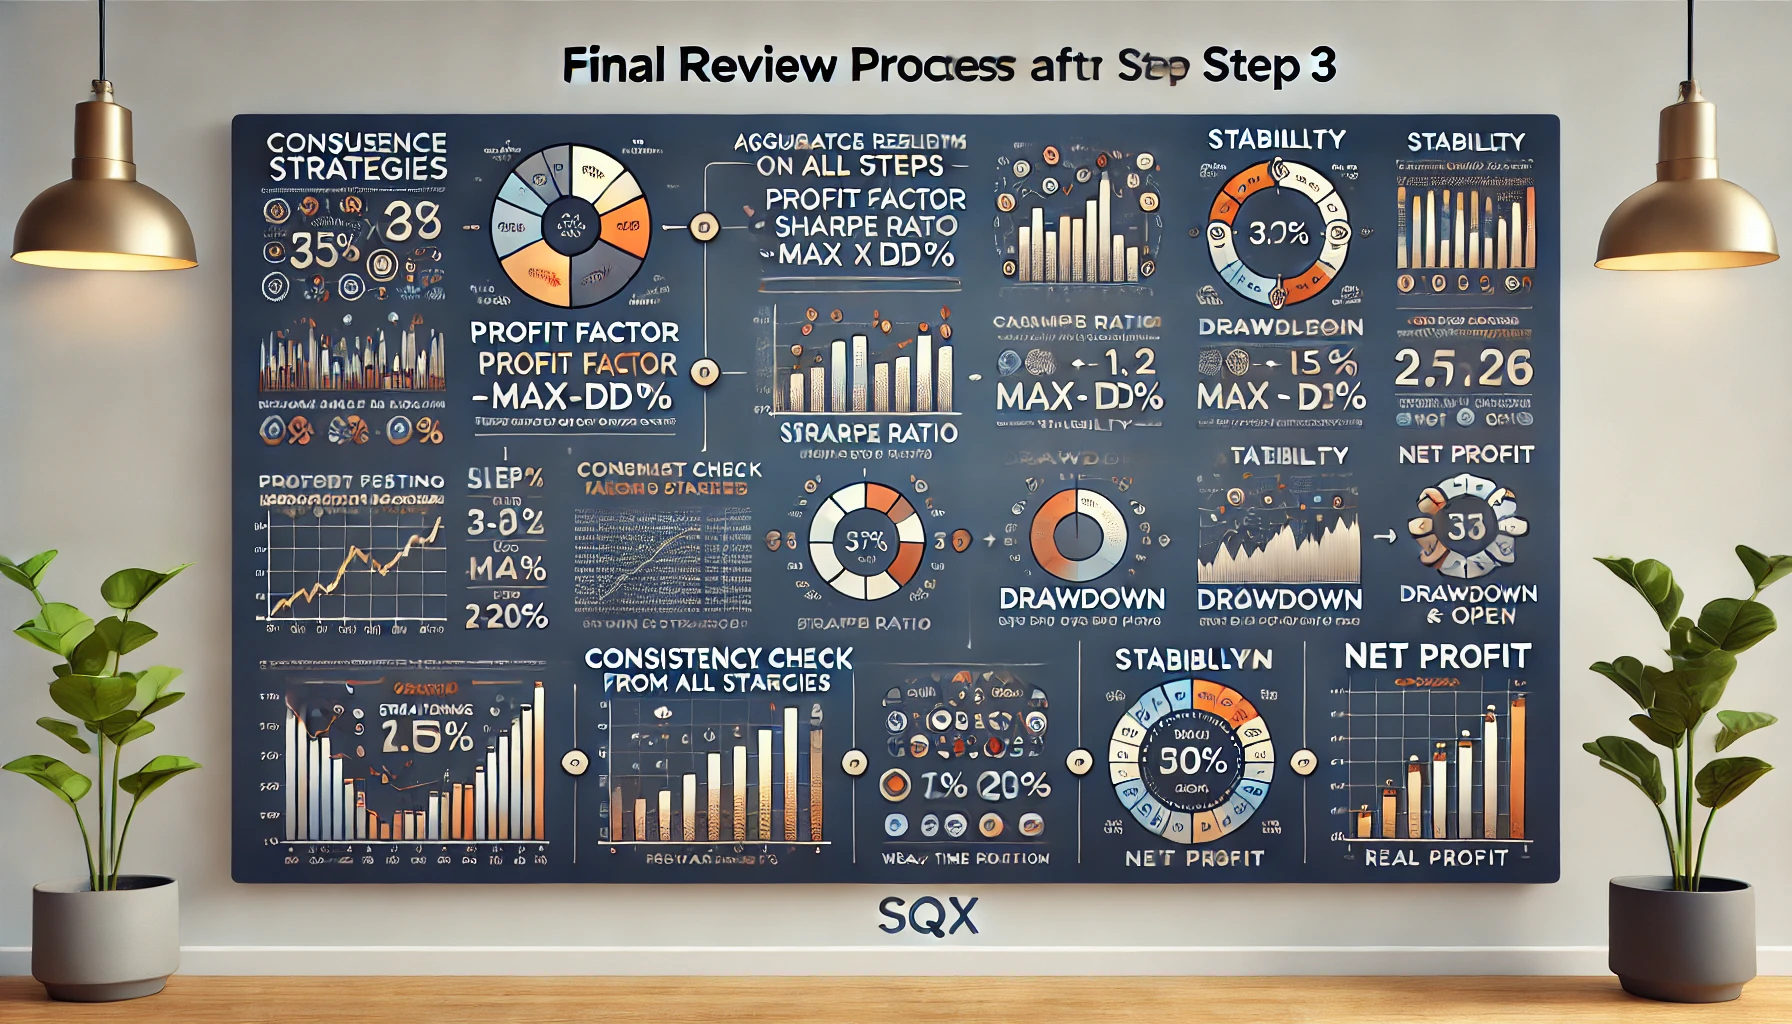
After completing Step 3 (the Walk-Forward Matrix with real tick data), the next step for a final review and comparison involves thorough analysis and filtering to confirm the robustness and reliability of the strategies. Here’s what you should do:
1. Aggregate Results from All Steps:
- Compile the performance metrics from Step 1 (Selected TF + Monte Carlo), Step 2 (1-Minute Data Tick), and Step 3 (Real Tick Data with Walk-Forward Matrix).
- Metrics to compare include:
- Profit Factor
- Sharpe Ratio
- CAGR/Max DD%
- Drawdown (Max and Open)
- Stability
- Win/Loss Ratio
- Net Profit
2. Consistency Check Across Steps:
- Compare Performance Metrics: Ensure that strategies performing well in Steps 1 and 2 still show good results in Step 3.
- Consistency Across Steps: Prioritize strategies that maintain strong performance and meet your criteria in all testing phases. For example, a strategy with a profit factor consistently above your threshold across all steps is likely more robust.
- Stability Analysis: Verify that the stability metric (e.g., > 0.8) is maintained across the steps, which indicates a consistent equity curve and reduced risk of erratic behavior.
3. Look for Outliers:
- Identify strategies that show significant performance drops or volatility in Step 3 compared to Steps 1 and 2. A drop in metrics such as the Sharpe ratio or a spike in drawdown during the Walk-Forward analysis can signal potential weaknesses under live trading conditions.
4. Select the Most Robust Strategies:
- Filter strategies that pass your final criteria (e.g., consistent Sharpe ratio > 2, profit factor > 1.5, drawdown < 20%).
- Prioritize those that show minimal variation in performance metrics across different testing data sets, as this indicates adaptability and robustness.
5. Portfolio Creation:
- Create Portfolios: Use the most robust strategies to create diversified portfolios. Ensure that these portfolios balance different strategy types and timeframes to reduce risk.
- Simulate Portfolio Performance: Run a final simulation or backtest of your chosen portfolios on real tick data to evaluate how they perform together and assess their combined drawdown and profit factor.
6. Forward Testing and Live Demo:
- Forward Test: Run your selected strategies or portfolios in a live demo account for a few weeks to a few months. This will help validate the strategies’ performance in real-time conditions without risking capital.
- Monitor Performance: Continuously track key metrics and look for consistency with backtested and Walk-Forward results.
7. Compare and Review the Results:
- Final Review Report: Create a comparison report summarizing the performance of each strategy across all testing steps and during the forward test. Highlight key metrics, any significant deviations, and overall performance trends.
- Decision Making: Choose to proceed with strategies or portfolios that maintain robust performance throughout all phases, as they are likely to be the most reliable for live trading.
This comprehensive review ensures that the strategies you move forward with are robust, adaptable, and optimized for real trading environments.

