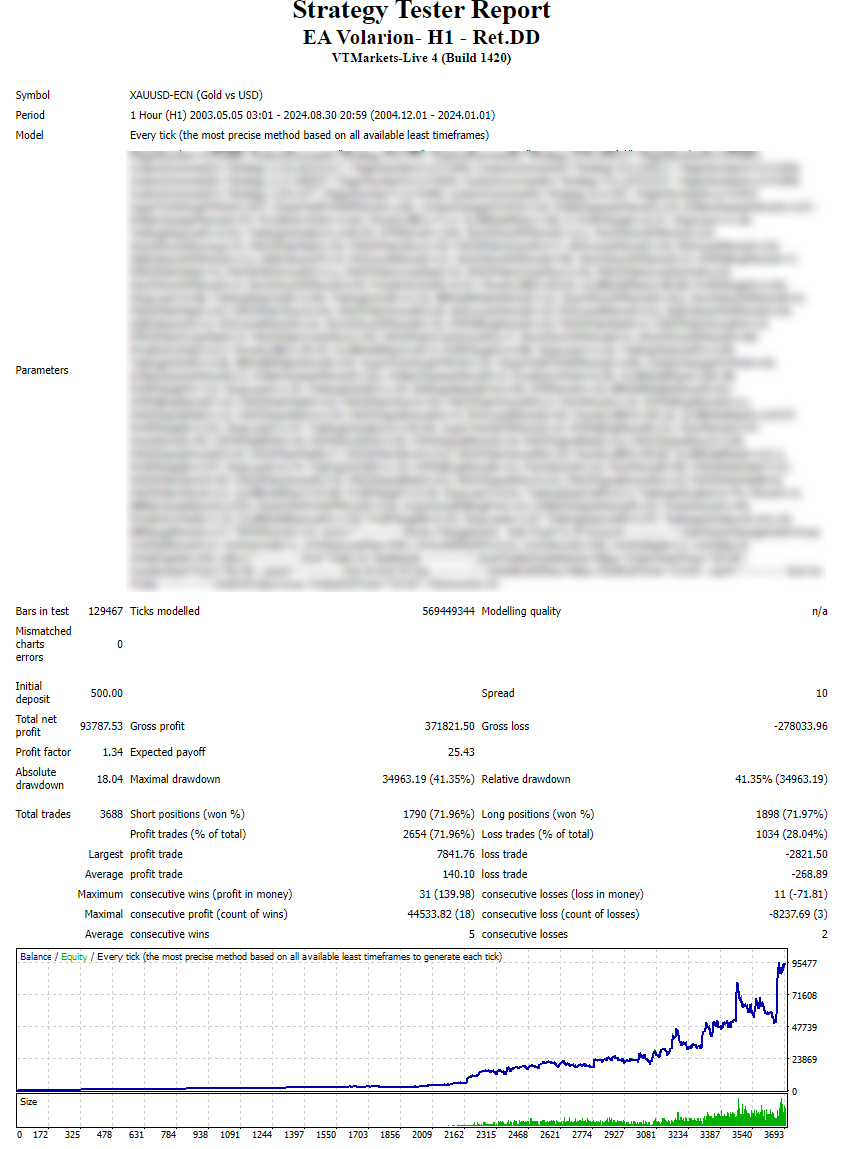
Let's break down the key performance metrics from your results and analyze them in the context of your trading goals:
1. Net Profit:
- Total Net Profit: $93,787.53 (starting from an initial deposit of $500)
- Comment: This is a strong profit in absolute terms, especially with the relatively small initial deposit. However, profitability must be assessed alongside risk (drawdown and volatility).
2. Drawdown:
- Maximal Drawdown: $34,963.19 (41.35%)
- Relative Drawdown: 41.35%
- Absolute Drawdown: $18.04
- Comment: The drawdown of 41.35% is quite high. While the strategy is profitable, it exposes a large portion of the account to risk at times, which might be undesirable for long-term sustainability. Ideally, for a safer strategy, you'd want to aim for a drawdown under 20% to balance risk and reward.
3. Profitability Ratios:
Profit Factor: 1.34
- Comment: A profit factor of 1.34 means that for every dollar lost, the strategy earns $1.34. This indicates the strategy is profitable but could be stronger. A profit factor above 1.5 would provide more confidence, and 2.0 or higher is ideal for long-term strategies.
Expected Payoff: 25.43
- Comment: This means that on average, the strategy makes $25.43 per trade. For a total of 3,688 trades, this suggests consistency in generating profits.
4. Win/Loss Statistics:
Total Trades: 3,688
- Profit Trades: 2,654 (71.96%)
- Loss Trades: 1,034 (28.04%)
- Comment: A win rate of about 72% is very strong. It suggests the strategy has a good ability to capture profitable trades. However, the average profit per trade ($140.10) is smaller compared to the average loss ($268.89), which impacts the overall profit factor.
Largest Profit/Loss Trade: $7,841.76 vs. -$2,821.50
- Comment: The largest profit trade is significantly larger than the largest loss trade, which is a positive sign.
Consecutive Wins/Losses: 31 wins vs. 11 losses
- Comment: The streak of 31 consecutive wins versus 11 consecutive losses suggests the strategy can perform well during favorable market conditions.
5. Trade Duration:
- Average Consecutive Wins: 5
- Average Consecutive Losses: 2
- Comment: A higher number of consecutive wins compared to losses is encouraging and shows that the strategy recovers from drawdowns relatively quickly.
6. Risk-Reward:
- Maximal Consecutive Profit: $44,533.82 (18 trades)
- Maximal Consecutive Loss: -$8,237.69 (3 trades)
- Comment: The risk-reward ratio appears favorable when looking at the maximal consecutive profit versus loss trades, though the drawdown during losing streaks needs careful monitoring.
Key Areas for Improvement:
- Drawdown: At over 41%, the drawdown is higher than desired. Reducing this could make the strategy more stable for long-term use.
- Profit Factor: Improving the profit factor beyond 1.34 would enhance profitability. Adjusting stop-loss/take-profit levels or optimizing risk management might help.
- Risk-Reward Ratio: The fact that losses on average are larger than profits is a concern. Consider adjusting position sizing, stop losses, or trailing stop mechanisms to address this.
Final Thoughts:
- Good profitability and high win rate, but the drawdown is a major risk factor. The high average loss per losing trade relative to the average win also suggests there's room for optimizing your exit strategy.
- To enhance stability and performance over the long term, consider refining risk management techniques such as position sizing, trailing stops, and perhaps adjusting the trading signals slightly to capture more favorable risk-reward ratios.