The XLS files have been successfully loaded, and the data appears consistent with clear column labels for "Profit/Loss," "MAE ($)," and "MFE ($)." I will now clean and analyze these files to provide insights on their risk management and profitability. Let's proceed with the analysis of the first batch.
Here's a summary analysis of the 10 EAs from the XLS files:
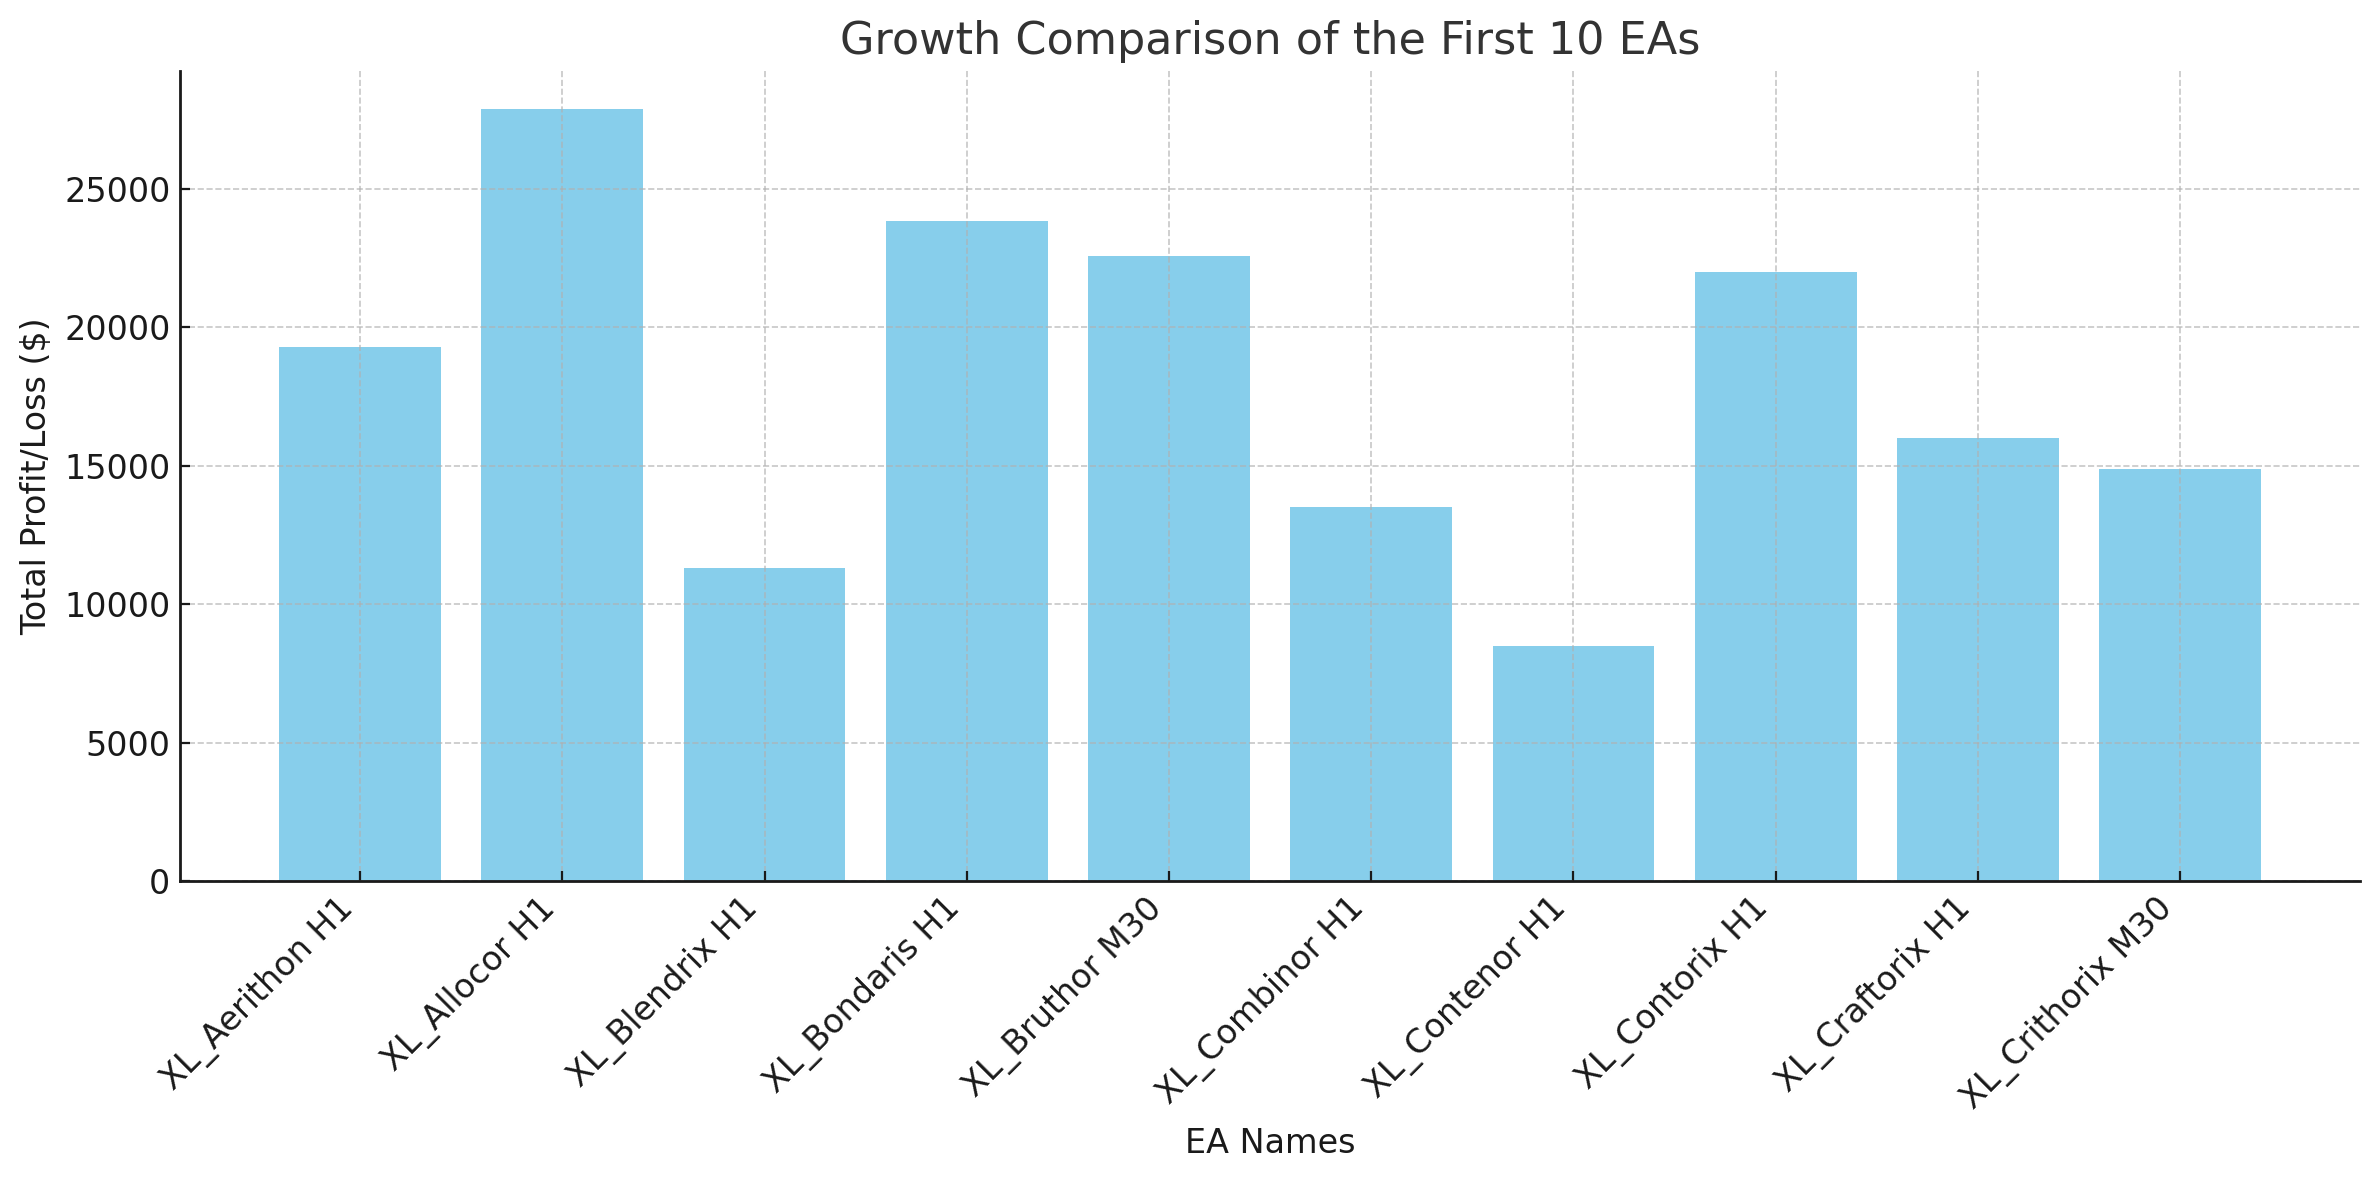
Total Profit/Loss:
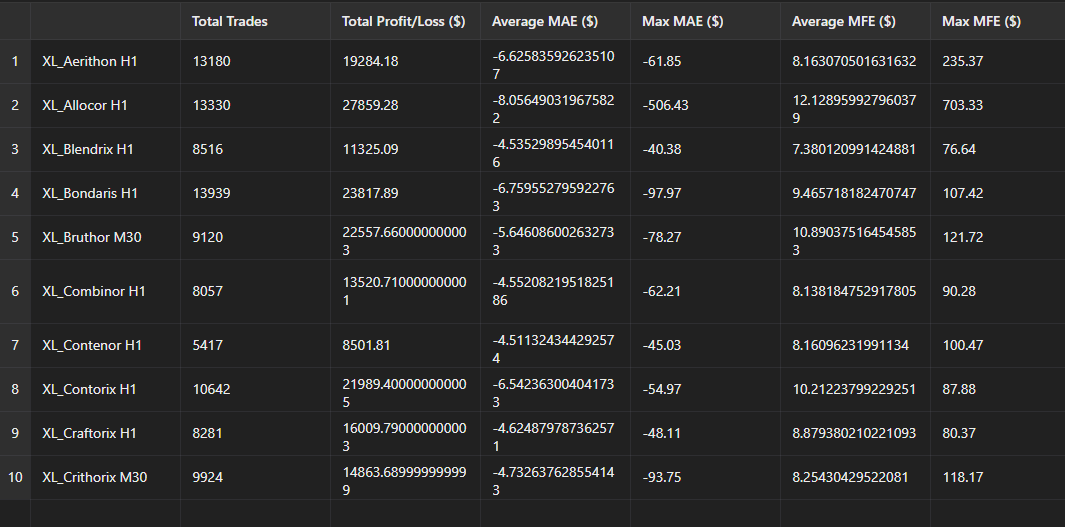
- Top Performers: "XL_Allocor H1" ($27,859.28) and "XL_Bondaris H1" ($23,817.89) showed the highest overall profitability.
- Lowest Profit: "XL_Contenor H1" had a modest profit of $8,501.81.
Risk Exposure (MAE):
- Lowest Risk: "XL_Blendrix H1" and "XL_Craftorix H1" had relatively low average MAE, indicating controlled risk.
- Highest Risk: "XL_Allocor H1" had the highest max MAE of -$506.43, signaling significant drawdowns in some trades.
Potential Trade Efficiency (MFE):
- Most Efficient: "XL_Allocor H1" with an average MFE of $12.13 and a maximum MFE of $703.33, suggesting strong profit potential.
- Less Efficient: "XL_Blendrix H1" had the lowest max MFE at $76.64.
Best Overall:
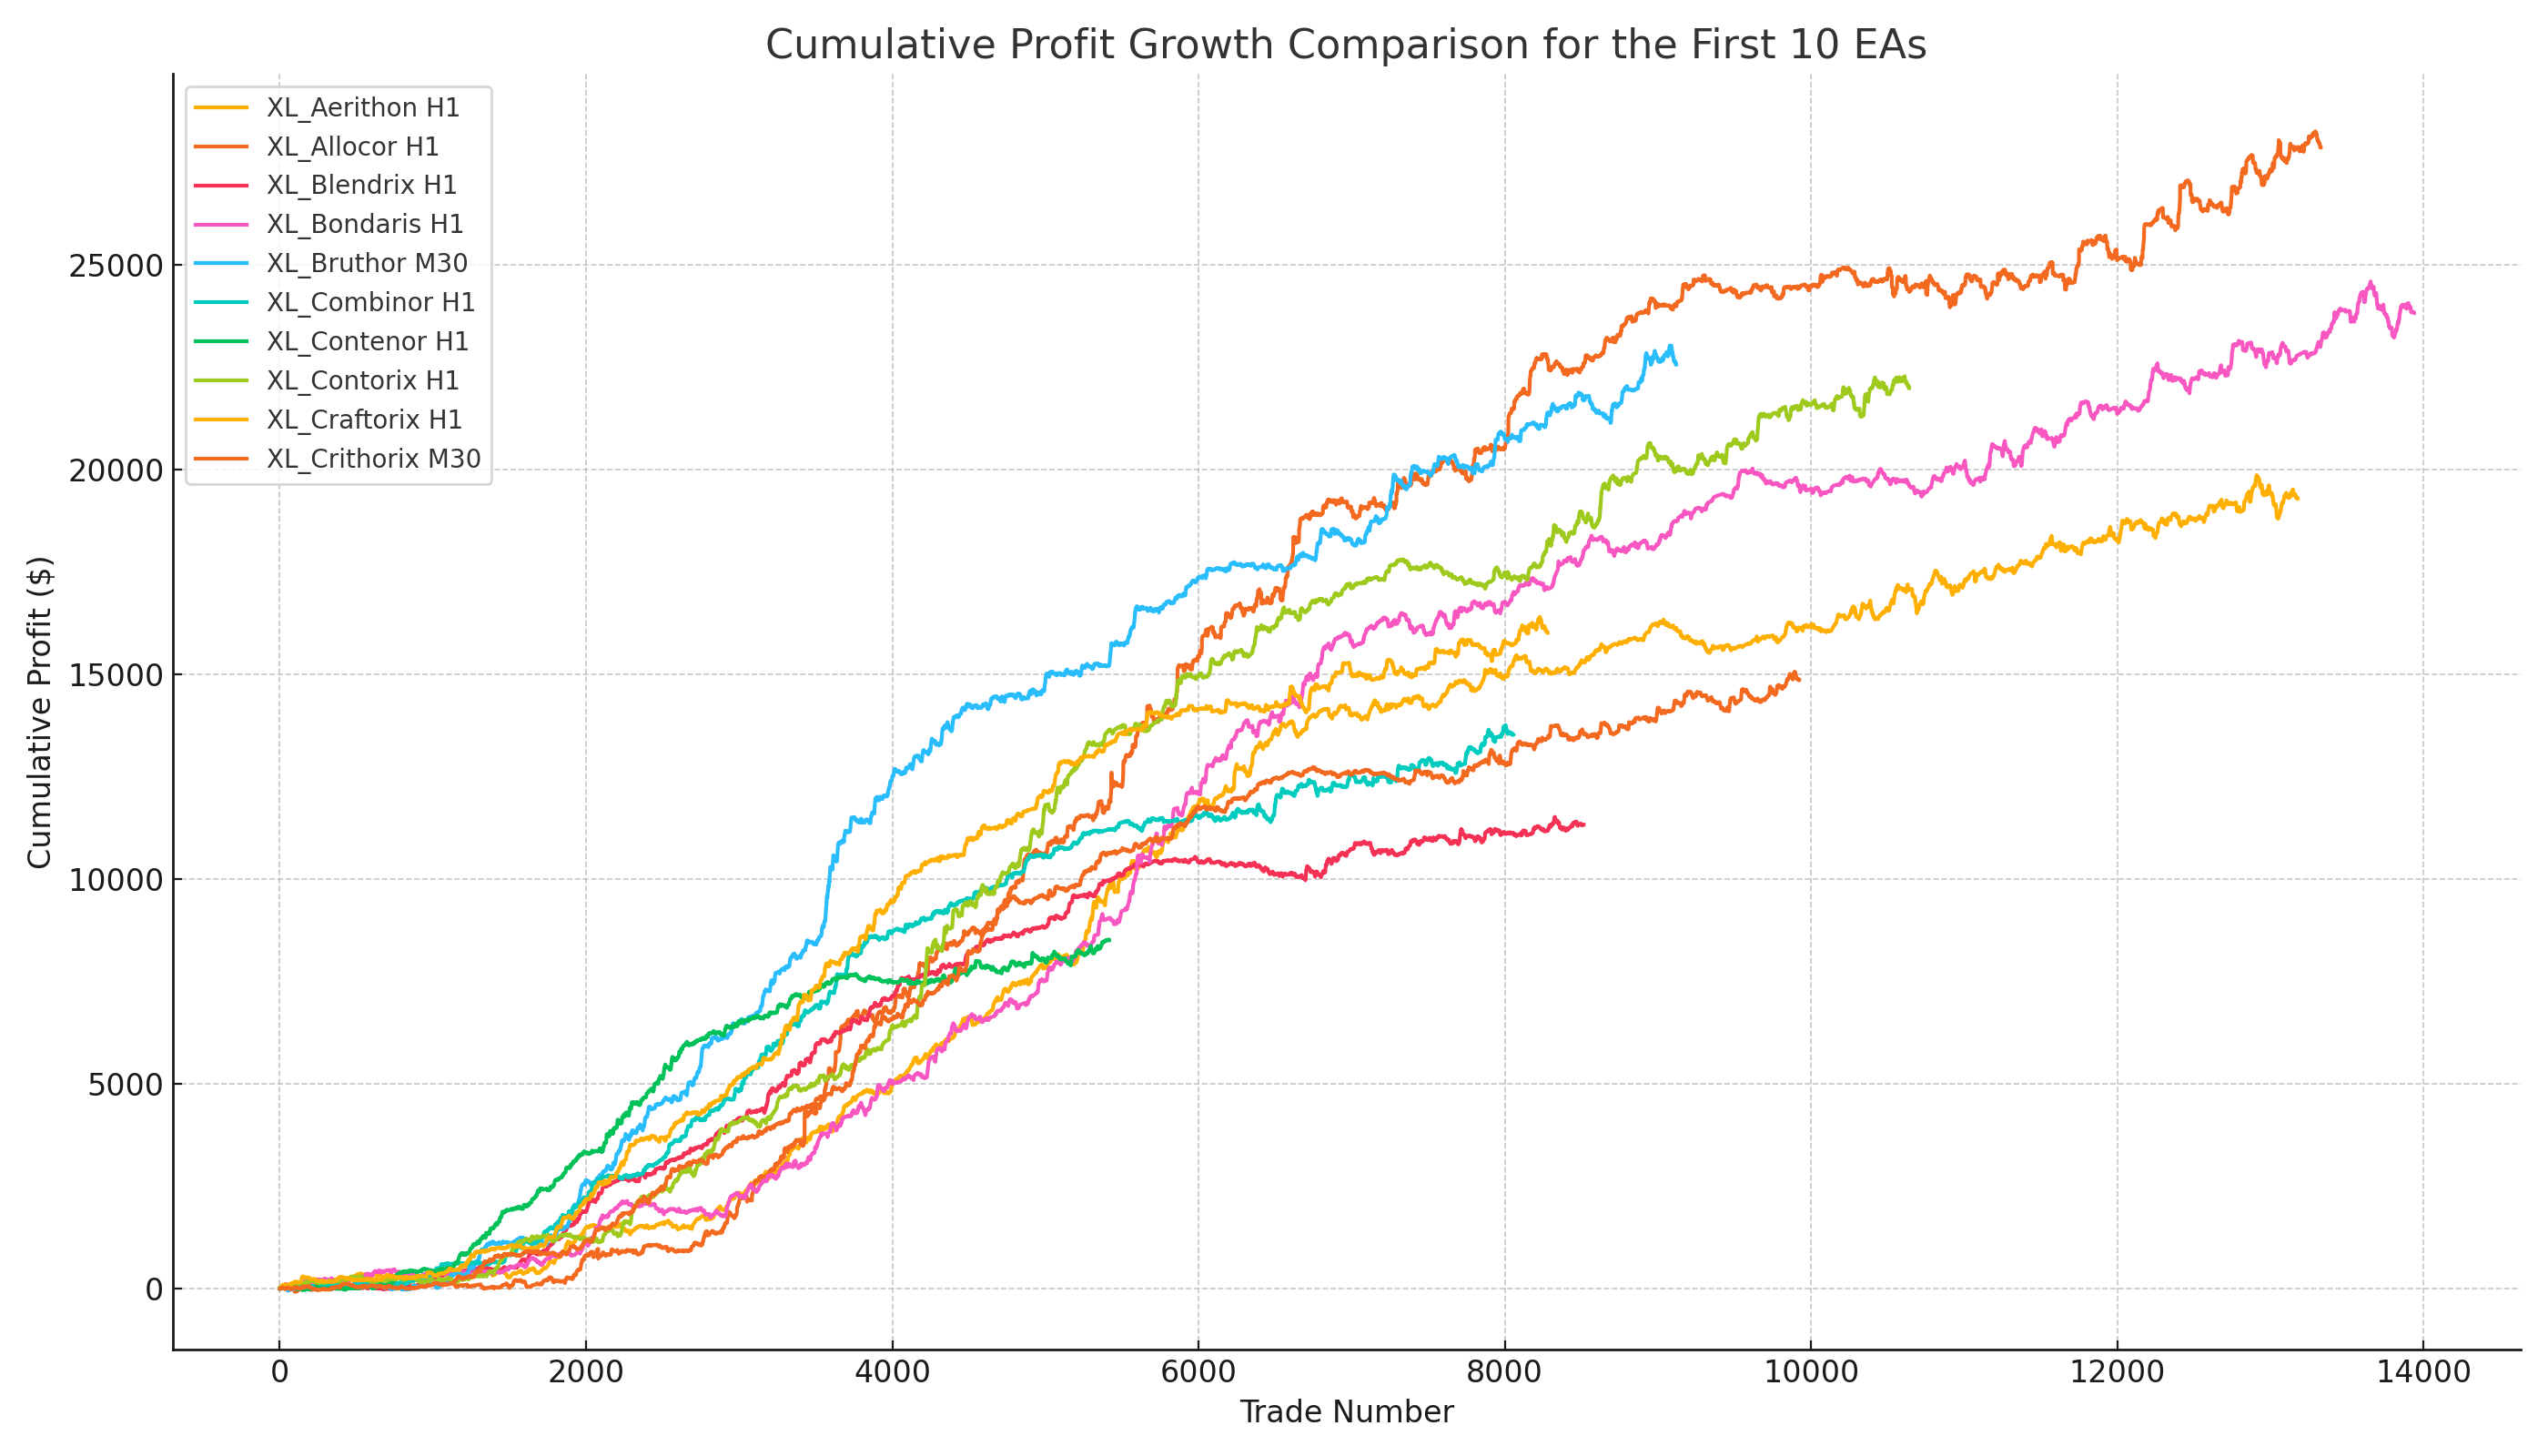
- XL_Allocor H1 stands out as the best performer due to its high total profit and strong MFE, despite the higher risk exposure.
- Balanced Choice: "XL_Bruthor M30" offers a good balance with solid profit and manageable MAE.
These insights can help you decide which EAs to include in your portfolio based on your risk tolerance and profit expectations. If you'd like further comparison or analysis of additional data, let me know!

