The second group of 10 EAs has been successfully loaded from the XLS files, showing consistent column labels and trade data. I'll proceed to clean and analyze these dataframes for risk and profitability metrics to provide insights on their performance. Let's move forward with the analysis.
Here's the analysis summary for the second group of 10 EAs:
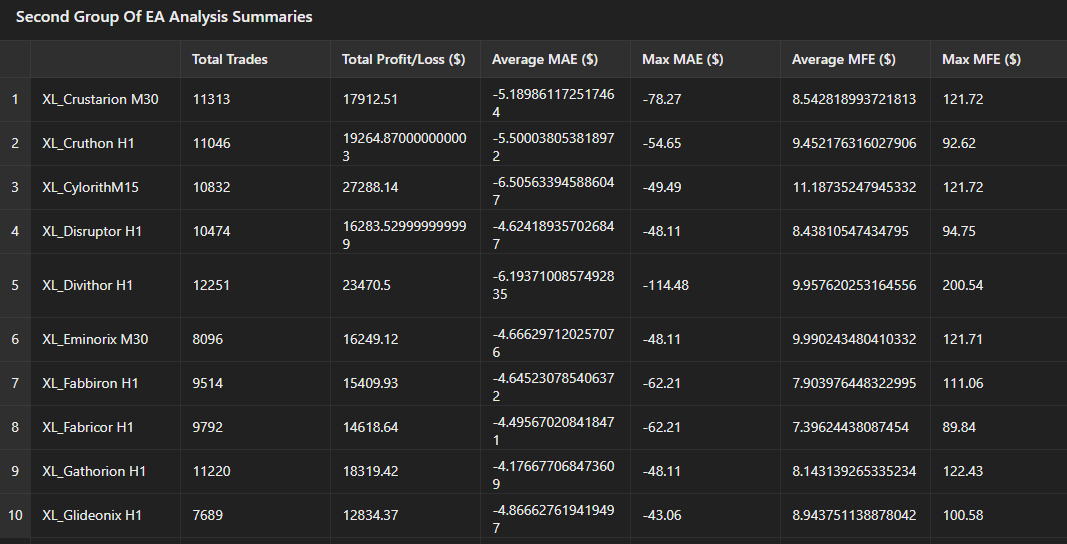
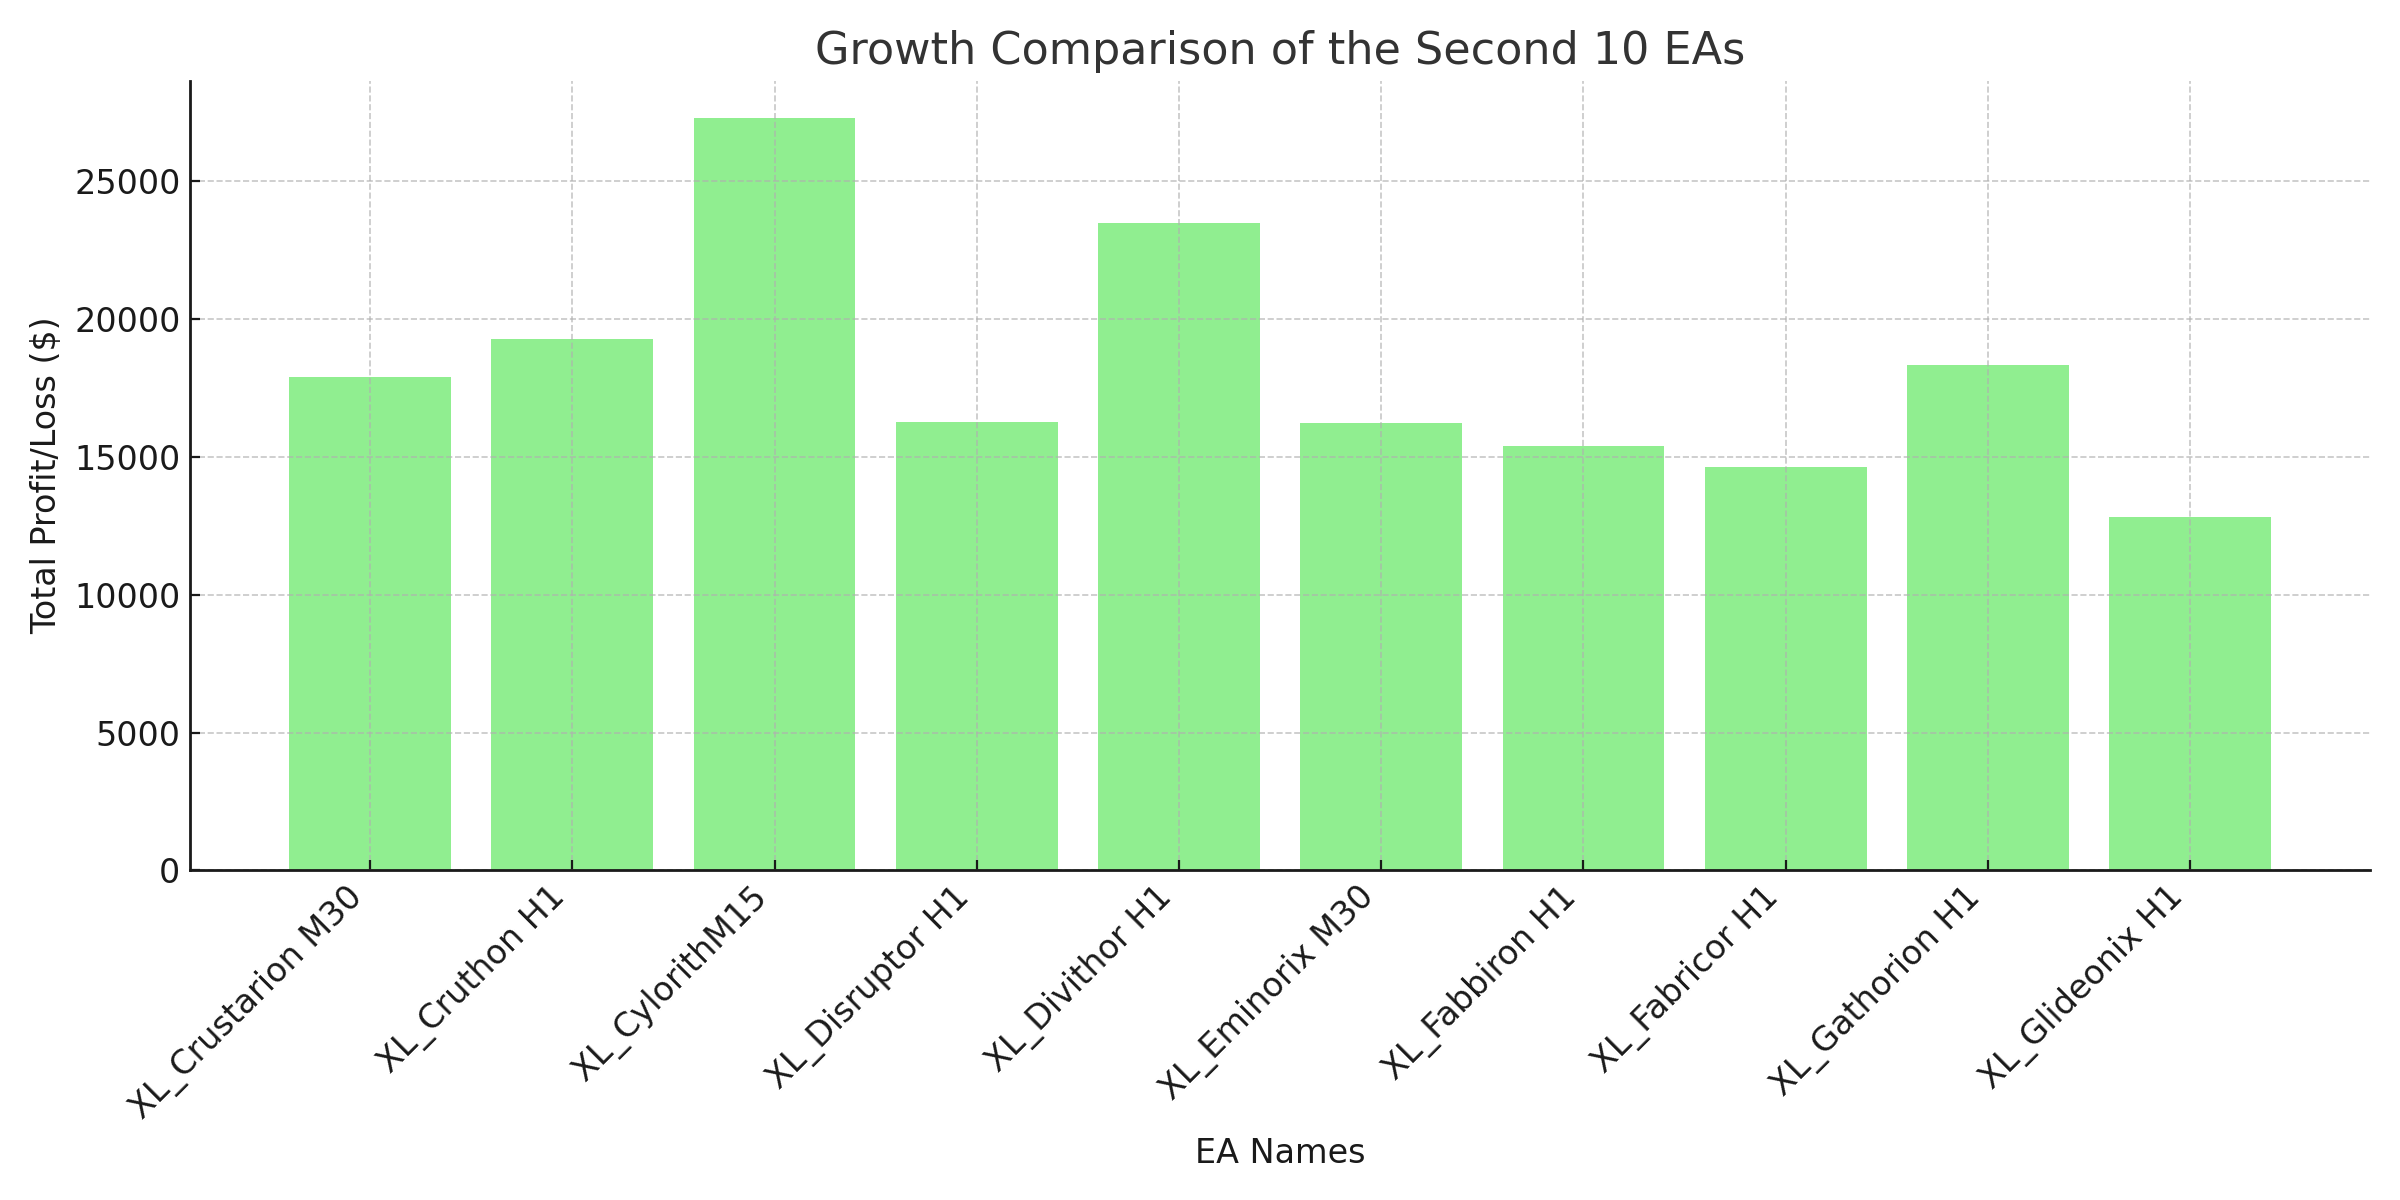
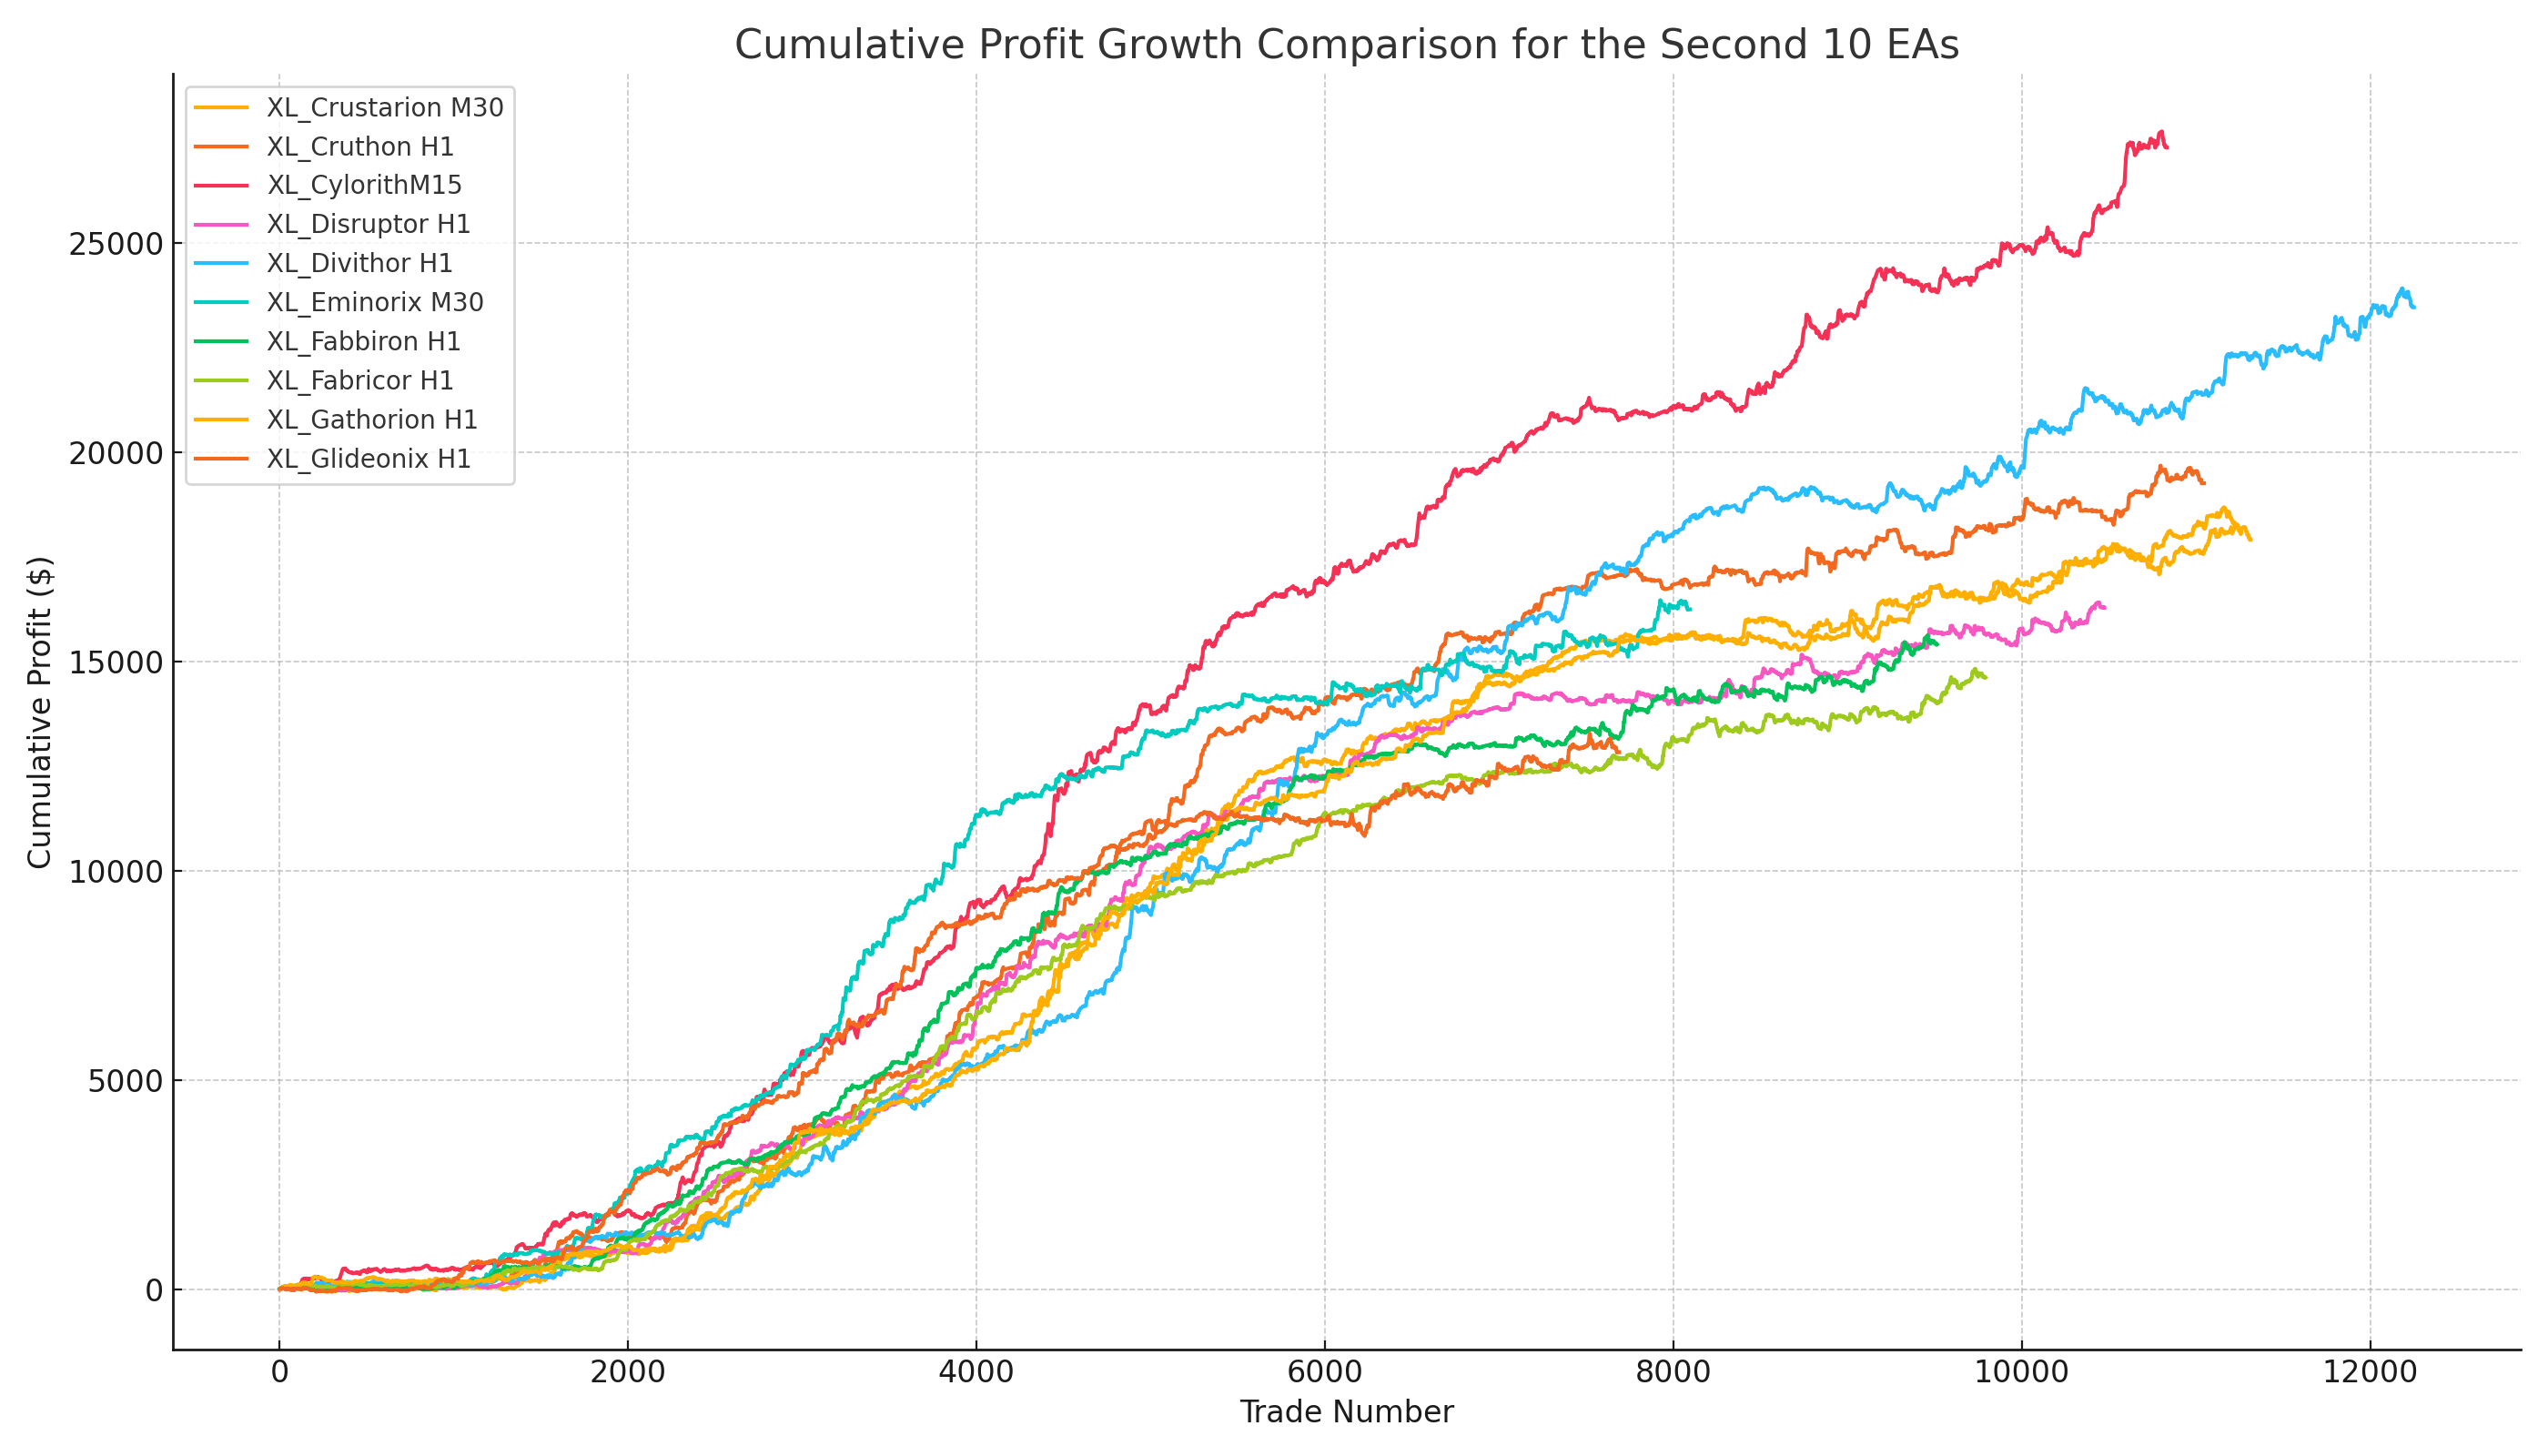
Total Profit/Loss:
- Top Performers: "XL_CylorithM15" with $27,288.14 and "XL_Divithor H1" with $23,470.50 showed the highest overall profitability.
- Lower Profit: "XL_Glideonix H1" had a total profit of $12,834.37, which, while positive, was lower compared to the top performers.
Risk Exposure (MAE):
- Lowest Average MAE: "XL_Gathorion H1" had the lowest average MAE at -$4.18, indicating a controlled risk level.
- Highest Risk: "XL_Divithor H1" had the highest max MAE at -$114.48, signaling significant drawdowns in some trades.
Potential Trade Efficiency (MFE):
- Most Efficient: "XL_CylorithM15" had the highest average MFE of $11.19, indicating strong potential profits per trade.
- Lower Efficiency: "XL_Fabricor H1" showed a lower average MFE at $7.40.
Best Overall:
- XL_CylorithM15 stands out as the best performer due to its combination of high profit and good average MFE, despite slightly higher MAE.
- Balanced Choice: "XL_Crustarion M30" offered solid profitability with reasonable risk exposure and average MFE.
Would you like to proceed with the analysis of the next set of 20 files, or is there any additional detail you'd like from these results?

